FB (Meta) - Recovery Along Trend Line
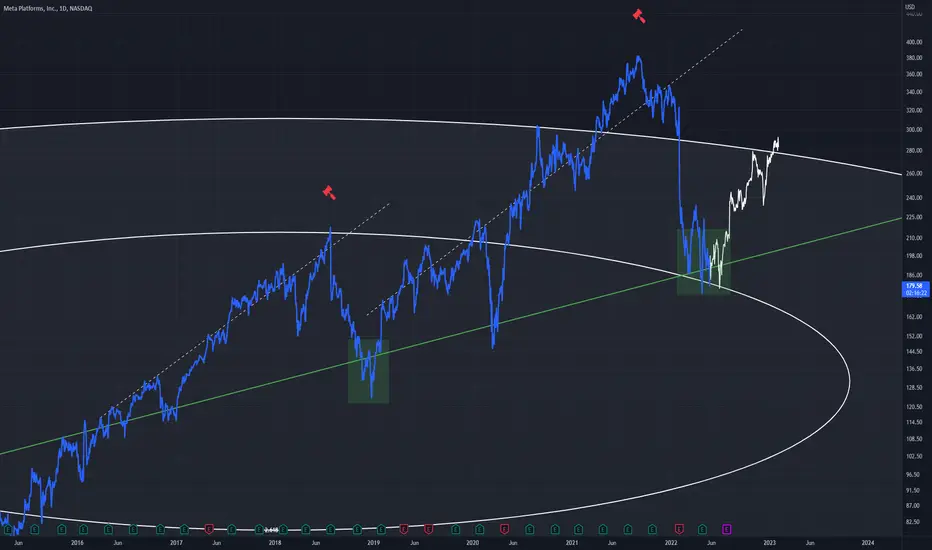
Similarities can be seen between the first dotted upward trend leading to a rejection, and the second also leading to a rejection
Both retrace to the same uptrend
This is the daily chart, with the first rejection at 2.618 and the second at 4.618
Good buy potential on this daily timeframe
Both retrace to the same uptrend
This is the daily chart, with the first rejection at 2.618 and the second at 4.618
Good buy potential on this daily timeframe

Wyłączenie odpowiedzialności
Informacje i publikacje nie stanowią i nie powinny być traktowane jako porady finansowe, inwestycyjne, tradingowe ani jakiekolwiek inne rekomendacje dostarczane lub zatwierdzone przez TradingView. Więcej informacji znajduje się w Warunkach użytkowania.
Wyłączenie odpowiedzialności
Informacje i publikacje nie stanowią i nie powinny być traktowane jako porady finansowe, inwestycyjne, tradingowe ani jakiekolwiek inne rekomendacje dostarczane lub zatwierdzone przez TradingView. Więcej informacji znajduje się w Warunkach użytkowania.