
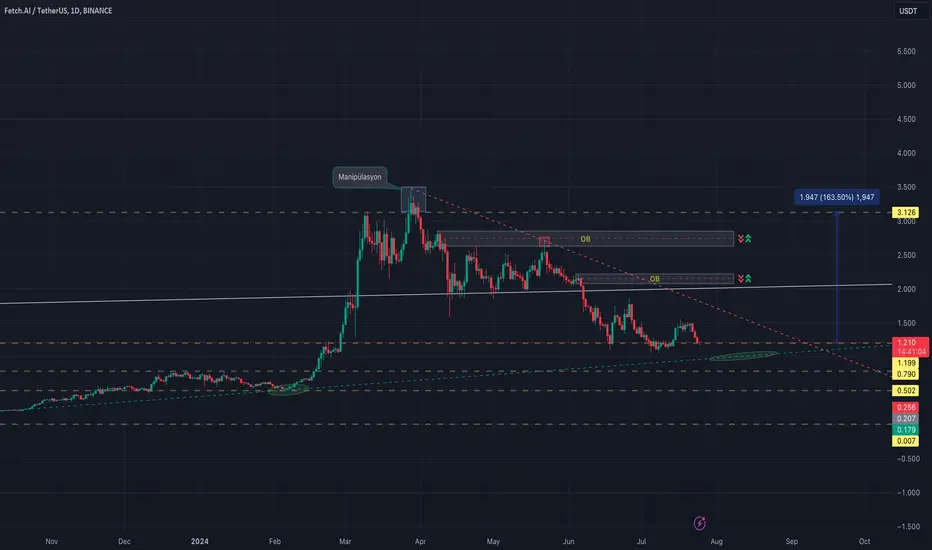
 FET 1D chart;
The $1,199 level is a strong resistance and it seems to be using it as a balance level.
If there is another possible pullback, it may hit the lower trend line.
It is moving towards a narrowing between the trends and it would not be a surprise if it makes an upward move after the squeeze.
We can consider OB levels as possible resistance zones. Therefore, it may make retracements from here.

For more you can follow me on X. @UgurTash
Wyłączenie odpowiedzialności
Informacje i publikacje nie stanowią i nie powinny być traktowane jako porady finansowe, inwestycyjne, tradingowe ani jakiekolwiek inne rekomendacje dostarczane lub zatwierdzone przez TradingView. Więcej informacji znajduje się w Warunkach użytkowania.
For more you can follow me on X. @UgurTash
Wyłączenie odpowiedzialności
Informacje i publikacje nie stanowią i nie powinny być traktowane jako porady finansowe, inwestycyjne, tradingowe ani jakiekolwiek inne rekomendacje dostarczane lub zatwierdzone przez TradingView. Więcej informacji znajduje się w Warunkach użytkowania.