
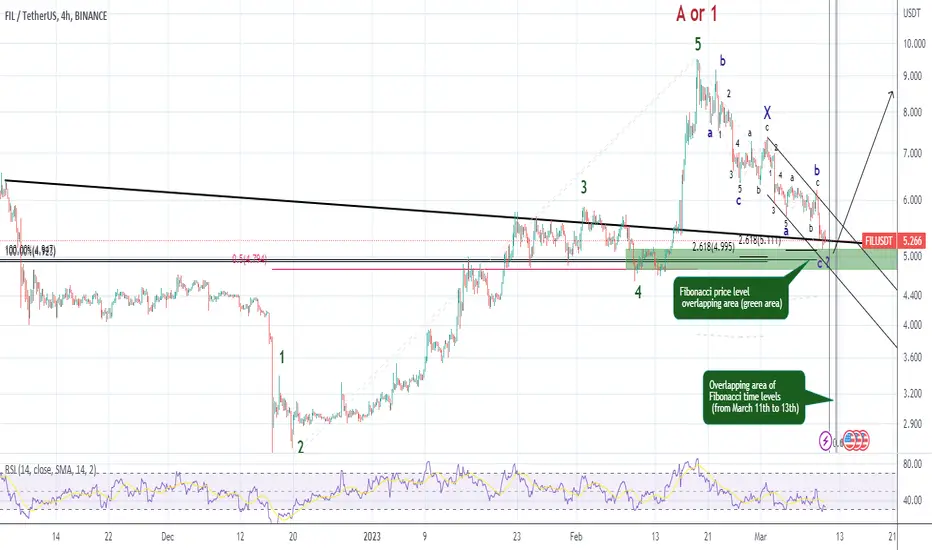
According to the price chart, it is located in the overlapping area of the Fibonacci price levels. And also the price is near a static resistance and a support trend line.
According to the price pattern on the chart, the price is "probably" at the end of its corrective pattern. In my opinion, this correction pattern should end between the 11th and 13th of March.
And the least I expect after the correction pattern ends is for the price to rise to the top of wave A or 1.
But the main targets of this price increase are respectively $20 (100% Fibonacci extension of wave A or 1 from the bottom of the corrective pattern) and $46 (162% Fibonacci extension).
And finally I see $183 (Fibonacci extension 262%).
According to the price pattern on the chart, the price is "probably" at the end of its corrective pattern. In my opinion, this correction pattern should end between the 11th and 13th of March.
And the least I expect after the correction pattern ends is for the price to rise to the top of wave A or 1.
But the main targets of this price increase are respectively $20 (100% Fibonacci extension of wave A or 1 from the bottom of the corrective pattern) and $46 (162% Fibonacci extension).
And finally I see $183 (Fibonacci extension 262%).

Wyłączenie odpowiedzialności
Informacje i publikacje nie stanowią i nie powinny być traktowane jako porady finansowe, inwestycyjne, tradingowe ani jakiekolwiek inne rekomendacje dostarczane lub zatwierdzone przez TradingView. Więcej informacji znajduje się w Warunkach użytkowania.
Wyłączenie odpowiedzialności
Informacje i publikacje nie stanowią i nie powinny być traktowane jako porady finansowe, inwestycyjne, tradingowe ani jakiekolwiek inne rekomendacje dostarczane lub zatwierdzone przez TradingView. Więcej informacji znajduje się w Warunkach użytkowania.