
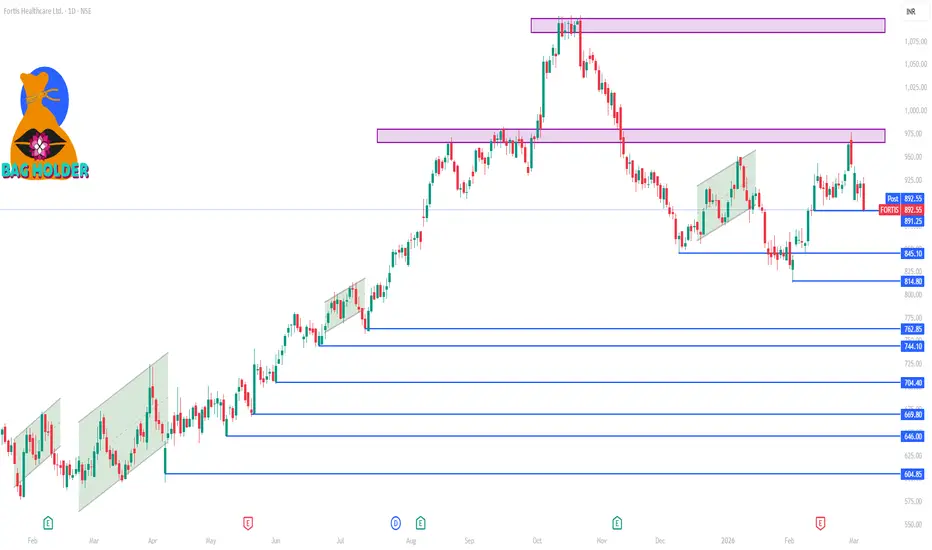
📈 Current Price Context (approx)
The stock has been trading recently around ₹890–930 on the NSE/BSE range, with 52‑week high ~₹1,104 and low ~₹595**.
📊 Key Levels for the 1‑Week Time Frame
🔹 Resistance Zones
These are levels where price has historically faced selling pressure and may struggle to move above in the short run:
₹927–₹934 – First resistance zone near recent pivot resistance.
₹939–₹946 – Next larger upside barrier.
₹950+ – Break above this puts focus toward the recent 52‑week high cluster.
🔸 Support Zones
Buying interest historically appears when price dips toward these zones:
₹900–₹910 – Near near‑term support/pivot zone (also recent intra‑week pivot).
₹890–₹898 – Lower support cluster near short‑term averages.
₹870–₹880 – Broader cushion from 200‑day MA and previous swing lows.
📌 What This Means in a 1‑Week Trading Frame
Neutral to modest bullish bias around pivot levels near ₹900–₹910; sustaining above this could allow tests of resistance ~₹927–₹946.
If price breaks below ₹890–₹880, further downside toward mid‑term support ~₹860–₹870 becomes more likely.
Oscillators like RSI/Stoch are currently in neutral/above average range — not strongly overbought yet — suggesting limited immediate exhaustion.
📍 Summary Levels (1‑Week Focus)
Category Zone
Immediate Support ₹900 – ₹910
Secondary Support ₹890 – ₹880
First Resistance ₹927 – ₹934
Primary Resistance ₹939 – ₹946
The stock has been trading recently around ₹890–930 on the NSE/BSE range, with 52‑week high ~₹1,104 and low ~₹595**.
📊 Key Levels for the 1‑Week Time Frame
🔹 Resistance Zones
These are levels where price has historically faced selling pressure and may struggle to move above in the short run:
₹927–₹934 – First resistance zone near recent pivot resistance.
₹939–₹946 – Next larger upside barrier.
₹950+ – Break above this puts focus toward the recent 52‑week high cluster.
🔸 Support Zones
Buying interest historically appears when price dips toward these zones:
₹900–₹910 – Near near‑term support/pivot zone (also recent intra‑week pivot).
₹890–₹898 – Lower support cluster near short‑term averages.
₹870–₹880 – Broader cushion from 200‑day MA and previous swing lows.
📌 What This Means in a 1‑Week Trading Frame
Neutral to modest bullish bias around pivot levels near ₹900–₹910; sustaining above this could allow tests of resistance ~₹927–₹946.
If price breaks below ₹890–₹880, further downside toward mid‑term support ~₹860–₹870 becomes more likely.
Oscillators like RSI/Stoch are currently in neutral/above average range — not strongly overbought yet — suggesting limited immediate exhaustion.
📍 Summary Levels (1‑Week Focus)
Category Zone
Immediate Support ₹900 – ₹910
Secondary Support ₹890 – ₹880
First Resistance ₹927 – ₹934
Primary Resistance ₹939 – ₹946

Contact Knowledgehub for a detailed consultation: Dm on WhatsApp: [wa.link/a2o0kz]-
Phone No: [+91 93102 26243]-
Email: [tradingviewknowledgehub@gmail.com]---
-- Let’s achieve success together!
Phone No: [+91 93102 26243]-
Email: [tradingviewknowledgehub@gmail.com]---
-- Let’s achieve success together!
Powiązane publikacje
Wyłączenie odpowiedzialności
Informacje i publikacje nie stanowią i nie powinny być traktowane jako porady finansowe, inwestycyjne, tradingowe ani jakiekolwiek inne rekomendacje dostarczane lub zatwierdzone przez TradingView. Więcej informacji znajduje się w Warunkach użytkowania.
Contact Knowledgehub for a detailed consultation: Dm on WhatsApp: [wa.link/a2o0kz]-
Phone No: [+91 93102 26243]-
Email: [tradingviewknowledgehub@gmail.com]---
-- Let’s achieve success together!
Phone No: [+91 93102 26243]-
Email: [tradingviewknowledgehub@gmail.com]---
-- Let’s achieve success together!
Powiązane publikacje
Wyłączenie odpowiedzialności
Informacje i publikacje nie stanowią i nie powinny być traktowane jako porady finansowe, inwestycyjne, tradingowe ani jakiekolwiek inne rekomendacje dostarczane lub zatwierdzone przez TradingView. Więcej informacji znajduje się w Warunkach użytkowania.