Long
FSLY in a Bullish Wedge?
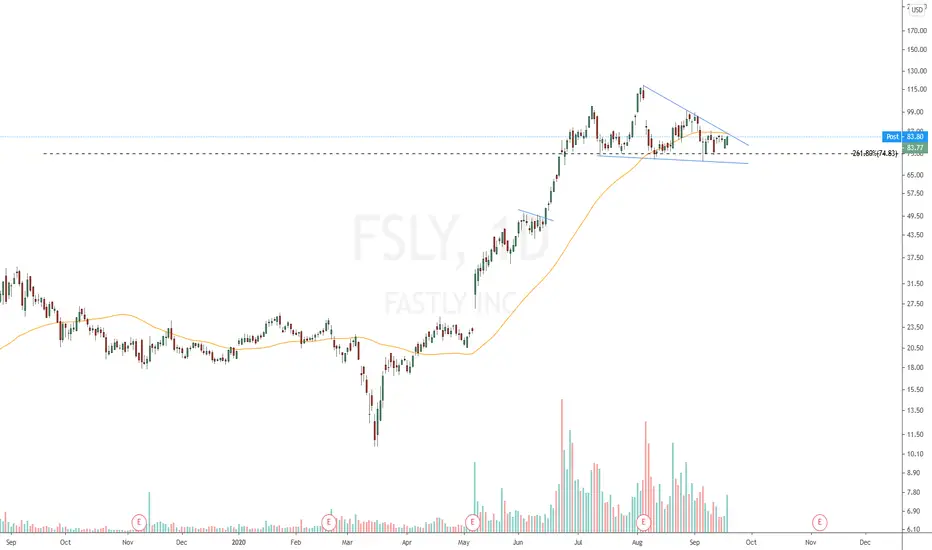
I had been thinking that FSLY was forming a head and shoulders top - but I've come around to interpreting it as a bullish wedge after this weeks action. It continues to find support at a key level. It also printed a shakeout candle (reversal) on 09/04 after breaking to new lows. Breaking out from the wedge would also be a break of the 50-day moving average. Taking out the "right shoulder" would likely propel this thing to new all-time highs. Price action this week has steady despite the tech selloff. I think there's a lot to like about this FSLY chart. Maybe next week?

Wyłączenie odpowiedzialności
Informacje i publikacje nie stanowią i nie powinny być traktowane jako porady finansowe, inwestycyjne, tradingowe ani jakiekolwiek inne rekomendacje dostarczane lub zatwierdzone przez TradingView. Więcej informacji znajduje się w Warunkach użytkowania.
Wyłączenie odpowiedzialności
Informacje i publikacje nie stanowią i nie powinny być traktowane jako porady finansowe, inwestycyjne, tradingowe ani jakiekolwiek inne rekomendacje dostarczane lub zatwierdzone przez TradingView. Więcej informacji znajduje się w Warunkach użytkowania.