Two $FSR opportunities same chart
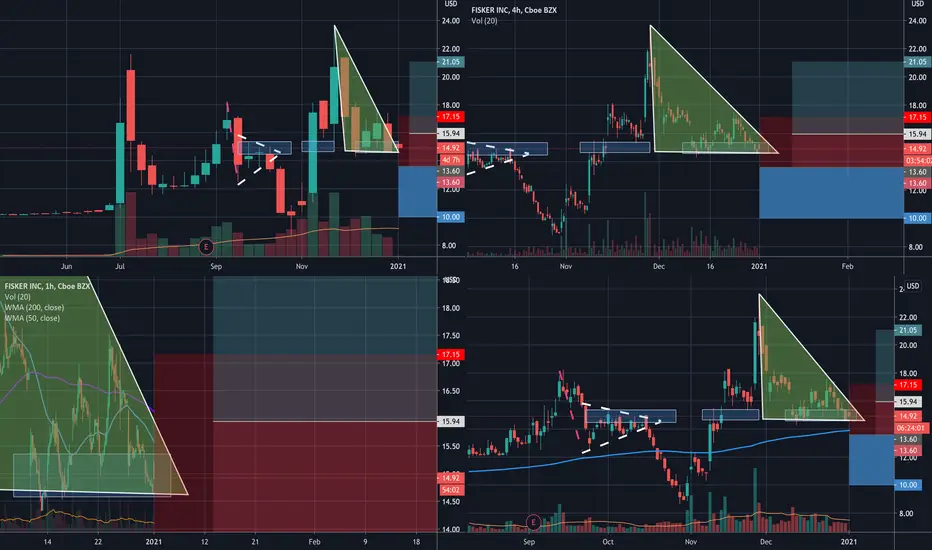
This is what I meant when I say anticipate your opponent.
This chart shows two opposite opportunities. Technically speaking it has a descending triangle which is a bearish pattern. However, as you may notice when price is at $14.50-15.50 range it tends to stall and play around that area. There is better R:R for the long opportunity. For a stock position, waiting on this one and letting price action decide which opportunity to take.
This chart shows two opposite opportunities. Technically speaking it has a descending triangle which is a bearish pattern. However, as you may notice when price is at $14.50-15.50 range it tends to stall and play around that area. There is better R:R for the long opportunity. For a stock position, waiting on this one and letting price action decide which opportunity to take.

Wyłączenie odpowiedzialności
Informacje i publikacje nie stanowią i nie powinny być traktowane jako porady finansowe, inwestycyjne, tradingowe ani jakiekolwiek inne rekomendacje dostarczane lub zatwierdzone przez TradingView. Więcej informacji znajduje się w Warunkach użytkowania.
Wyłączenie odpowiedzialności
Informacje i publikacje nie stanowią i nie powinny być traktowane jako porady finansowe, inwestycyjne, tradingowe ani jakiekolwiek inne rekomendacje dostarczane lub zatwierdzone przez TradingView. Więcej informacji znajduje się w Warunkach użytkowania.