

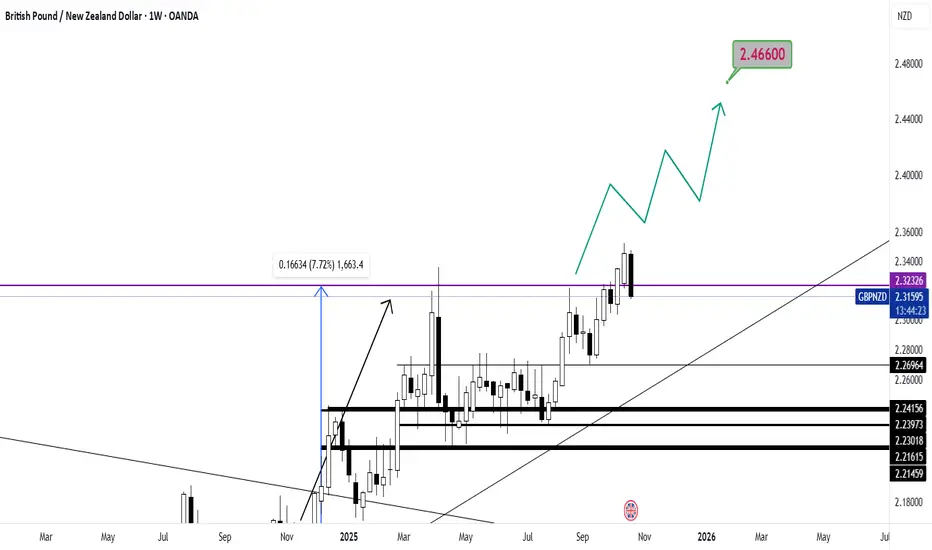
What appears on the chart is a change in the direction of upward fluctuations!
Now, why should these upward fluctuations or upward prospects appear on the chart, is a question that must be answered over time!
I hope that this time, like the previous analysis, we will reach the desired results with this indicator!
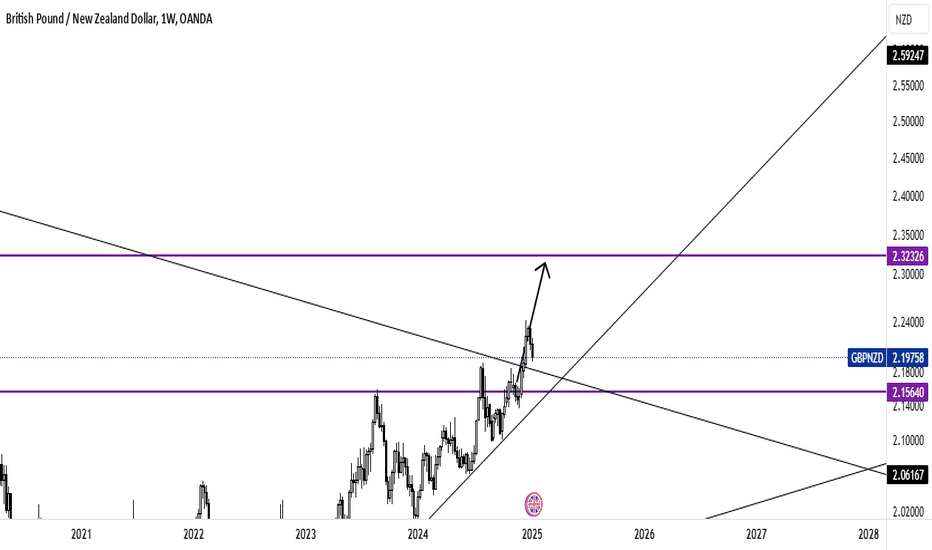
Good luck...
Now, why should these upward fluctuations or upward prospects appear on the chart, is a question that must be answered over time!
I hope that this time, like the previous analysis, we will reach the desired results with this indicator!
Good luck...

Wyłączenie odpowiedzialności
Informacje i publikacje nie stanowią i nie powinny być traktowane jako porady finansowe, inwestycyjne, tradingowe ani jakiekolwiek inne rekomendacje dostarczane lub zatwierdzone przez TradingView. Więcej informacji znajduje się w Warunkach użytkowania.
Wyłączenie odpowiedzialności
Informacje i publikacje nie stanowią i nie powinny być traktowane jako porady finansowe, inwestycyjne, tradingowe ani jakiekolwiek inne rekomendacje dostarczane lub zatwierdzone przez TradingView. Więcej informacji znajduje się w Warunkach użytkowania.