

Conversation with Gemini
Looks like that movements
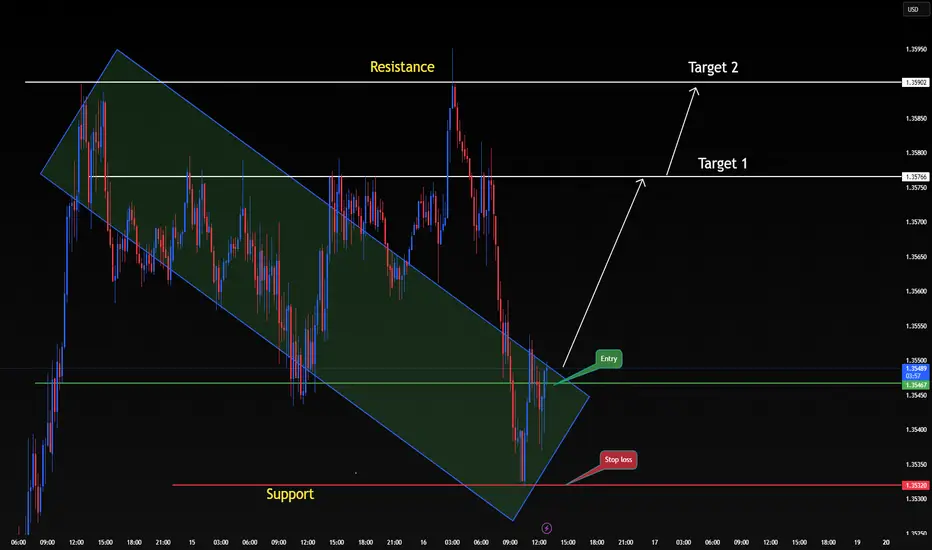
That chart shows a classic bullish breakout scenario for the GBP/USD pair. The price has been respecting a downward-sloping parallel channel for a while, but it looks like the momentum is finally shifting.
Here is a breakdown of what the setup suggests:
The Setup: Channel Breakout
The price was locked in a descending channel (the green shaded area), characterized by lower highs and lower lows. The recent movement shows price action breaking above the upper boundary of this channel, which is often a signal that the bearish trend is exhausted.
Key Levels & Strategy
Based on the annotations in the image, here is the technical roadmap:
Entry: The "Entry" point is set just above the breakout zone (around 1.3548). This confirms that buyers are stepping in to hold the price above the old resistance line.
Support & Stop Loss: There is a strong horizontal Support level marked at 1.3532. Placing a stop loss here protects the trade in case the breakout turns out to be a "fakeout" and price falls back into the channel.
Resistance & Targets:
Target 1 (1.3576): This aligns with a previous local peak and acts as the first major hurdle.
Target 2 (1.3590): This is the ultimate resistance level shown, representing a full recovery of the most recent significant drop.

Powiązane publikacje
Wyłączenie odpowiedzialności
Informacje i publikacje nie stanowią i nie powinny być traktowane jako porady finansowe, inwestycyjne, tradingowe ani jakiekolwiek inne rekomendacje dostarczane lub zatwierdzone przez TradingView. Więcej informacji znajduje się w Warunkach użytkowania.
Powiązane publikacje
Wyłączenie odpowiedzialności
Informacje i publikacje nie stanowią i nie powinny być traktowane jako porady finansowe, inwestycyjne, tradingowe ani jakiekolwiek inne rekomendacje dostarczane lub zatwierdzone przez TradingView. Więcej informacji znajduje się w Warunkach użytkowania.