

As explained yesterday
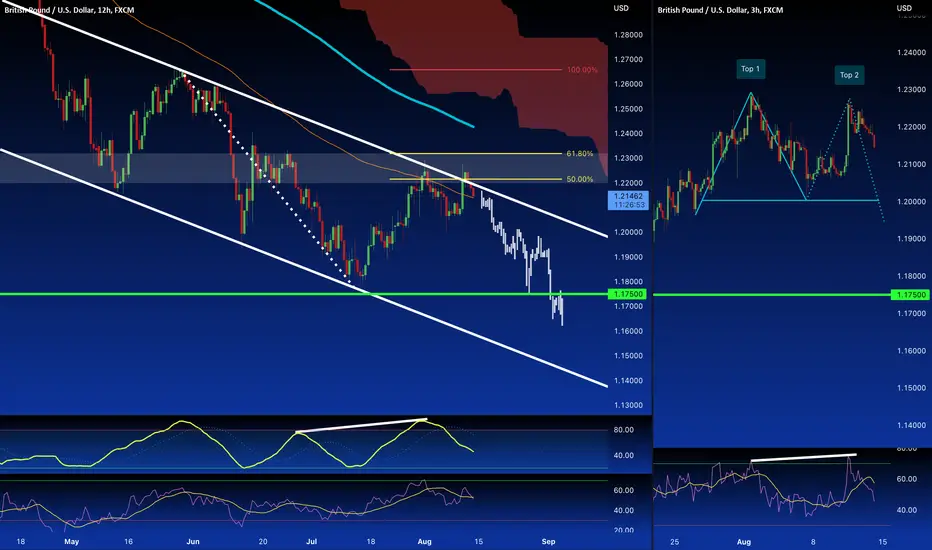
the price after the CPI release news had in a first moment Big Bullish candle, absorbed and then the retested again the Dynamic resistance given from the Bearish channel inside the 50 / 61.8% Fibo levels and Resistance area ( White rectangle ) before definitely dropdown. The Stochastic it's a comeback in the range area after the Overbought area, ( note the Divergence ) meanwhile, the RSI Turned Bearish today in the H12 timeframe.
In the lower timeframe, on the Right of the chart, we can see a Double Top formation with divergence and Overbought by the RSI.
Yesterday we show this opportunity and today the price dropped down following our Idea of the forecast.
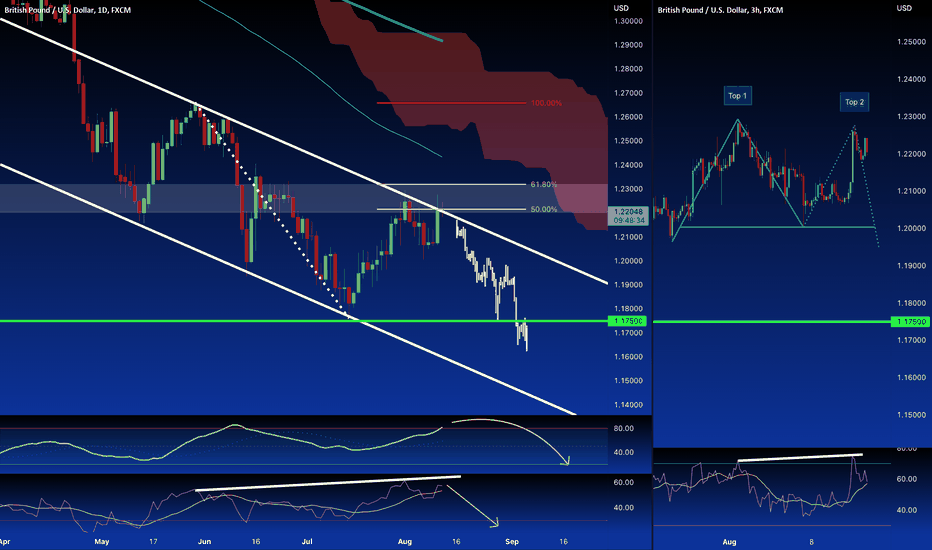
the price after the CPI release news had in a first moment Big Bullish candle, absorbed and then the retested again the Dynamic resistance given from the Bearish channel inside the 50 / 61.8% Fibo levels and Resistance area ( White rectangle ) before definitely dropdown. The Stochastic it's a comeback in the range area after the Overbought area, ( note the Divergence ) meanwhile, the RSI Turned Bearish today in the H12 timeframe.
In the lower timeframe, on the Right of the chart, we can see a Double Top formation with divergence and Overbought by the RSI.
Yesterday we show this opportunity and today the price dropped down following our Idea of the forecast.

Powiązane publikacje
Wyłączenie odpowiedzialności
Informacje i publikacje nie stanowią i nie powinny być traktowane jako porady finansowe, inwestycyjne, tradingowe ani jakiekolwiek inne rekomendacje dostarczane lub zatwierdzone przez TradingView. Więcej informacji znajduje się w Warunkach użytkowania.
Powiązane publikacje
Wyłączenie odpowiedzialności
Informacje i publikacje nie stanowią i nie powinny być traktowane jako porady finansowe, inwestycyjne, tradingowe ani jakiekolwiek inne rekomendacje dostarczane lub zatwierdzone przez TradingView. Więcej informacji znajduje się w Warunkach użytkowania.