Long
$GLCH long term view
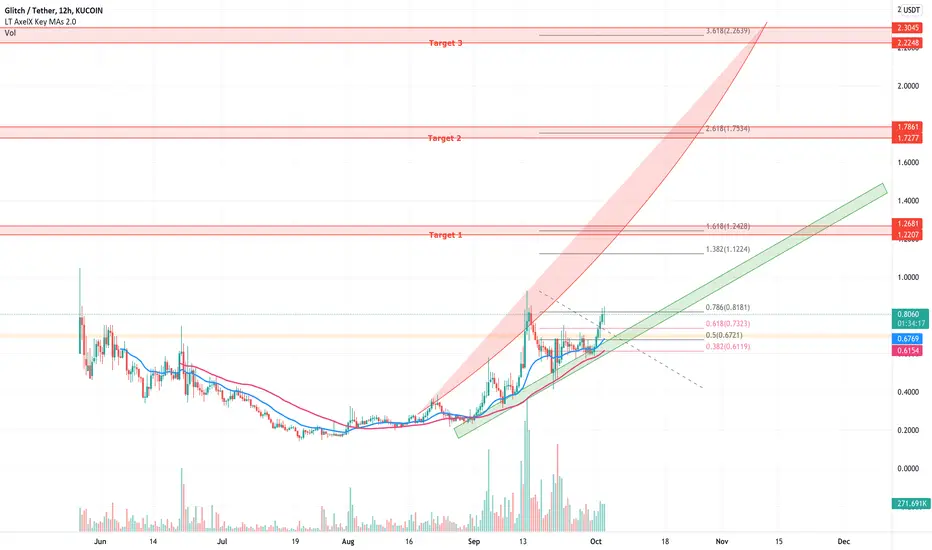
In this chart I show my expectations for $GLCH based on fib level and oversold/ overbought zones.
Red curve = overbought, we see a retranchement every time we get into this zone.
Green curve = accumulation, we get a pump every time we reach this zone.
First target around $1.25.
Target 2: $1.75
Target 3: $2.25
This chart will be updated once we go further in the cycle.
Red curve = overbought, we see a retranchement every time we get into this zone.
Green curve = accumulation, we get a pump every time we reach this zone.
First target around $1.25.
Target 2: $1.75
Target 3: $2.25
This chart will be updated once we go further in the cycle.

Wyłączenie odpowiedzialności
Informacje i publikacje nie stanowią i nie powinny być traktowane jako porady finansowe, inwestycyjne, tradingowe ani jakiekolwiek inne rekomendacje dostarczane lub zatwierdzone przez TradingView. Więcej informacji znajduje się w Warunkach użytkowania.
Wyłączenie odpowiedzialności
Informacje i publikacje nie stanowią i nie powinny być traktowane jako porady finansowe, inwestycyjne, tradingowe ani jakiekolwiek inne rekomendacje dostarczane lub zatwierdzone przez TradingView. Więcej informacji znajduje się w Warunkach użytkowania.