
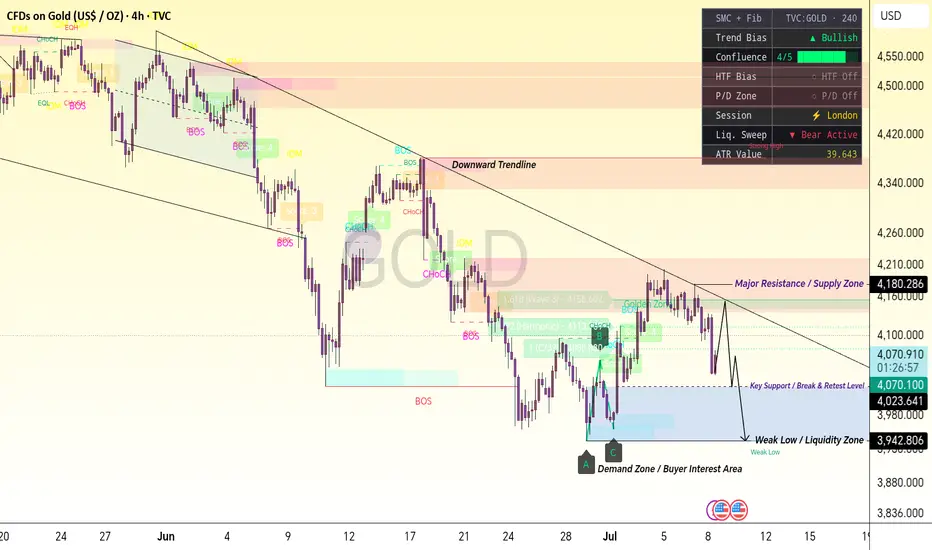
XAUUSD 4H | Smart Money Concept (SMC) Market Structure & Institutional Price Action Analysis
This chart presents a complete Smart Money Concept analysis of Gold (XAUUSD) based on market structure, liquidity behavior, supply and demand zones, trendline reaction, and institutional trading areas. The purpose of this educational analysis is to understand how price moves between liquidity zones and how smart money creates opportunities through accumulation, manipulation, and distribution.
Overall Market Structure
Gold is currently showing a corrective bearish structure after forming a strong selling sequence from higher levels. Price has respected the descending trendline multiple times, showing continuous rejection from sellers. The formation of Lower Highs (LH) and repeated Break of Structure (BOS) confirms that sellers are still active in the market.
The market is currently trading between a major resistance zone and a strong demand area, creating an important decision point where the next institutional move can develop.
---
Candle-by-Candle Price Action Analysis
1. Bearish Expansion Phase The first move shows strong bearish candles entering from the premium zone. Large impulsive candles indicate aggressive selling pressure and institutional distribution. Each bearish move created new BOS levels, confirming that sellers were controlling momentum.
2. Formation of Lower Highs After every recovery attempt, price failed to break previous highs and created new lower highs. These rejection candles represent sellers defending higher prices and maintaining the bearish trend structure.
3. Liquidity Collection Phase Price moved toward previous lows to collect sell-side liquidity. The long wicks and rejection candles around the lower area show that liquidity was taken before buyers started reacting.
4. Demand Zone Reaction The blue highlighted demand zone represents an area where buyers showed strong interest. Price reacted from this zone with bullish candles, showing accumulation and a possible short-term shift in momentum.
5. Change of Character (CHoCH) After the demand reaction, price created a short-term CHoCH by breaking minor bearish structure. This indicates that buyers are attempting to gain control, but confirmation is still required through stronger continuation.
6. Recovery Move The bullish candles after the demand zone show a corrective recovery. However, price is approaching a major supply area where previous sellers entered, making this zone important for future direction.
---
Important Chart Levels
4180 – Major Resistance / Supply Zone
This area represents a strong institutional selling zone. Price has previously shown rejection from this region. If price reaches this level again, traders should watch for bearish confirmation such as rejection candles, CHoCH, or liquidity sweep.
Above 4180: Possible bullish continuation.
Rejection from 4180: Possible move back toward lower liquidity.
---
4023 – Key Support / Break & Retest Level
This is an important reaction level where buyers are currently defending price. Holding above this area can support another upward attempt.
A clean break below this level may confirm weakness and open the path toward lower targets.
---
3942 – Weak Low / Liquidity Zone
This zone contains liquidity below previous lows. Smart money often targets weak lows to collect liquidity before making the next significant move.
A liquidity sweep below this area followed by a strong reversal can create a potential bullish reaction.
---
Trendline Analysis
The descending trendline represents continuous selling pressure from higher levels. Every rejection from this trendline shows that sellers are protecting the bearish structure.
A confirmed breakout above the trendline with a successful retest can indicate a possible change in market direction.
---
Smart Money Concept Summary
Market Structure: Bearish to Neutral Transition
Major Supply Zone: 4180 Area
Key Support Zone: 4023 Area
Liquidity Target: 3942 Area
Trendline: Downward Resistance
Current Phase: Price Testing Important Decision Area
The chart demonstrates how smart money reacts around liquidity, supply, and demand zones. Price is currently positioned between buyer interest and seller pressure, so confirmation through structure break, retest, and liquidity reaction is important.
Educational Purpose:
This analysis is created for learning Smart Money Concepts, including BOS, CHoCH, liquidity sweep, supply & demand, and institutional price behavior. Always combine multiple confirmations and proper risk management before taking any trading decision.
This chart presents a complete Smart Money Concept analysis of Gold (XAUUSD) based on market structure, liquidity behavior, supply and demand zones, trendline reaction, and institutional trading areas. The purpose of this educational analysis is to understand how price moves between liquidity zones and how smart money creates opportunities through accumulation, manipulation, and distribution.
Overall Market Structure
Gold is currently showing a corrective bearish structure after forming a strong selling sequence from higher levels. Price has respected the descending trendline multiple times, showing continuous rejection from sellers. The formation of Lower Highs (LH) and repeated Break of Structure (BOS) confirms that sellers are still active in the market.
The market is currently trading between a major resistance zone and a strong demand area, creating an important decision point where the next institutional move can develop.
---
Candle-by-Candle Price Action Analysis
1. Bearish Expansion Phase The first move shows strong bearish candles entering from the premium zone. Large impulsive candles indicate aggressive selling pressure and institutional distribution. Each bearish move created new BOS levels, confirming that sellers were controlling momentum.
2. Formation of Lower Highs After every recovery attempt, price failed to break previous highs and created new lower highs. These rejection candles represent sellers defending higher prices and maintaining the bearish trend structure.
3. Liquidity Collection Phase Price moved toward previous lows to collect sell-side liquidity. The long wicks and rejection candles around the lower area show that liquidity was taken before buyers started reacting.
4. Demand Zone Reaction The blue highlighted demand zone represents an area where buyers showed strong interest. Price reacted from this zone with bullish candles, showing accumulation and a possible short-term shift in momentum.
5. Change of Character (CHoCH) After the demand reaction, price created a short-term CHoCH by breaking minor bearish structure. This indicates that buyers are attempting to gain control, but confirmation is still required through stronger continuation.
6. Recovery Move The bullish candles after the demand zone show a corrective recovery. However, price is approaching a major supply area where previous sellers entered, making this zone important for future direction.
---
Important Chart Levels
4180 – Major Resistance / Supply Zone
This area represents a strong institutional selling zone. Price has previously shown rejection from this region. If price reaches this level again, traders should watch for bearish confirmation such as rejection candles, CHoCH, or liquidity sweep.
Above 4180: Possible bullish continuation.
Rejection from 4180: Possible move back toward lower liquidity.
---
4023 – Key Support / Break & Retest Level
This is an important reaction level where buyers are currently defending price. Holding above this area can support another upward attempt.
A clean break below this level may confirm weakness and open the path toward lower targets.
---
3942 – Weak Low / Liquidity Zone
This zone contains liquidity below previous lows. Smart money often targets weak lows to collect liquidity before making the next significant move.
A liquidity sweep below this area followed by a strong reversal can create a potential bullish reaction.
---
Trendline Analysis
The descending trendline represents continuous selling pressure from higher levels. Every rejection from this trendline shows that sellers are protecting the bearish structure.
A confirmed breakout above the trendline with a successful retest can indicate a possible change in market direction.
---
Smart Money Concept Summary
Market Structure: Bearish to Neutral Transition
Major Supply Zone: 4180 Area
Key Support Zone: 4023 Area
Liquidity Target: 3942 Area
Trendline: Downward Resistance
Current Phase: Price Testing Important Decision Area
The chart demonstrates how smart money reacts around liquidity, supply, and demand zones. Price is currently positioned between buyer interest and seller pressure, so confirmation through structure break, retest, and liquidity reaction is important.
Educational Purpose:
This analysis is created for learning Smart Money Concepts, including BOS, CHoCH, liquidity sweep, supply & demand, and institutional price behavior. Always combine multiple confirmations and proper risk management before taking any trading decision.
Uwaga

t.me/+HstI692sUGw0ZmRk
✅ MY FREE SIGNALS CHANNEL
✅ PERSONAL TELEGRAM
✅ FOREX BROKER USED
t.me/+pg7FHDH9Zl40MGJk
✅ MY FREE SIGNALS CHANNEL
✅ PERSONAL TELEGRAM
✅ FOREX BROKER USED
t.me/+pg7FHDH9Zl40MGJk
Powiązane publikacje
Wyłączenie odpowiedzialności
Informacje i publikacje nie stanowią i nie powinny być traktowane jako porady finansowe, inwestycyjne, tradingowe ani jakiekolwiek inne rekomendacje dostarczane lub zatwierdzone przez TradingView. Więcej informacji znajduje się w Warunkach użytkowania.
t.me/+HstI692sUGw0ZmRk
✅ MY FREE SIGNALS CHANNEL
✅ PERSONAL TELEGRAM
✅ FOREX BROKER USED
t.me/+pg7FHDH9Zl40MGJk
✅ MY FREE SIGNALS CHANNEL
✅ PERSONAL TELEGRAM
✅ FOREX BROKER USED
t.me/+pg7FHDH9Zl40MGJk
Powiązane publikacje
Wyłączenie odpowiedzialności
Informacje i publikacje nie stanowią i nie powinny być traktowane jako porady finansowe, inwestycyjne, tradingowe ani jakiekolwiek inne rekomendacje dostarczane lub zatwierdzone przez TradingView. Więcej informacji znajduje się w Warunkach użytkowania.