
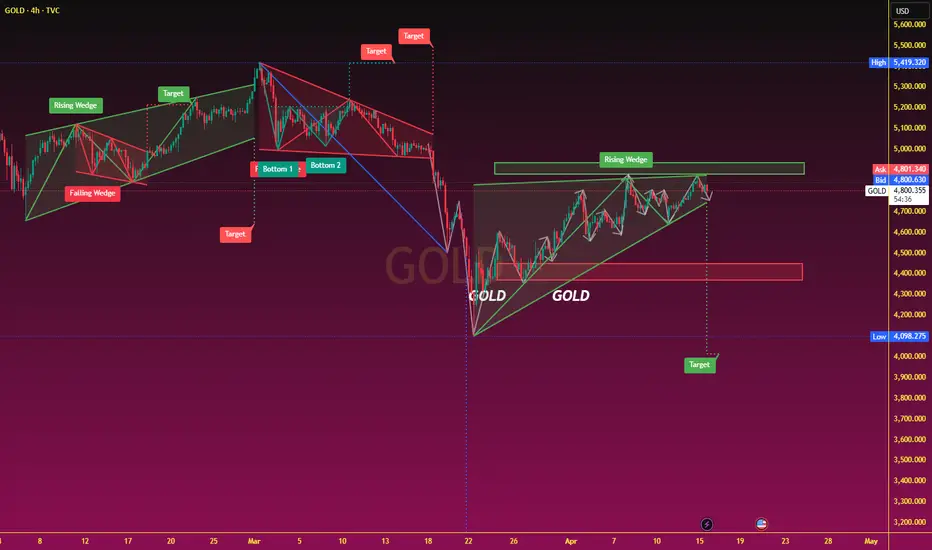
On the 4-hour chart, the price is testing the key 200-period moving average resistance, a crucial short-term support/resistance level. Indicators show the RSI near 65.5, close to overbought territory, indicating continued upward momentum but with signs of weakening. The MACD is above the zero line and expanding, suggesting the bullish trend remains intact. If the price effectively holds above the 200-period moving average and breaks through $4912 (61.8% Fibonacci retracement), it could open up further upside potential, targeting $5020 or even the previous high. Conversely, if the price fails to break through, it may fall back to test the $4756 support level, with further support around $4710.
In the short term, gold's resistance zone is locked in the $4850-$4889 range, a dense area of previous trapped positions; while the support zone is referenced to the recent dense trading area of $4740-$4765. If the geopolitical situation becomes clearer, gold prices may test the $4,700 level.
Analysis Summary: Gold is currently in a phase where multiple bullish factors are intertwined with short-term technical resistance. A weaker dollar and declining interest rate expectations provide a foundation for a medium-term upside, while geopolitical uncertainty increases market volatility. Technically, the trend remains bullish, but momentum has shown signs of slowing. The key to future price movements lies in whether it can effectively break through the $4,900 area. A breakout would open up further upside potential; otherwise, a period of correction is possible. Overall, gold is expected to maintain high-level consolidation in the short term, but still has upward potential in the medium term.
In the short term, gold's resistance zone is locked in the $4850-$4889 range, a dense area of previous trapped positions; while the support zone is referenced to the recent dense trading area of $4740-$4765. If the geopolitical situation becomes clearer, gold prices may test the $4,700 level.
Analysis Summary: Gold is currently in a phase where multiple bullish factors are intertwined with short-term technical resistance. A weaker dollar and declining interest rate expectations provide a foundation for a medium-term upside, while geopolitical uncertainty increases market volatility. Technically, the trend remains bullish, but momentum has shown signs of slowing. The key to future price movements lies in whether it can effectively break through the $4,900 area. A breakout would open up further upside potential; otherwise, a period of correction is possible. Overall, gold is expected to maintain high-level consolidation in the short term, but still has upward potential in the medium term.

Wyłączenie odpowiedzialności
Informacje i publikacje nie stanowią i nie powinny być traktowane jako porady finansowe, inwestycyjne, tradingowe ani jakiekolwiek inne rekomendacje dostarczane lub zatwierdzone przez TradingView. Więcej informacji znajduje się w Warunkach użytkowania.
Wyłączenie odpowiedzialności
Informacje i publikacje nie stanowią i nie powinny być traktowane jako porady finansowe, inwestycyjne, tradingowe ani jakiekolwiek inne rekomendacje dostarczane lub zatwierdzone przez TradingView. Więcej informacji znajduje się w Warunkach użytkowania.