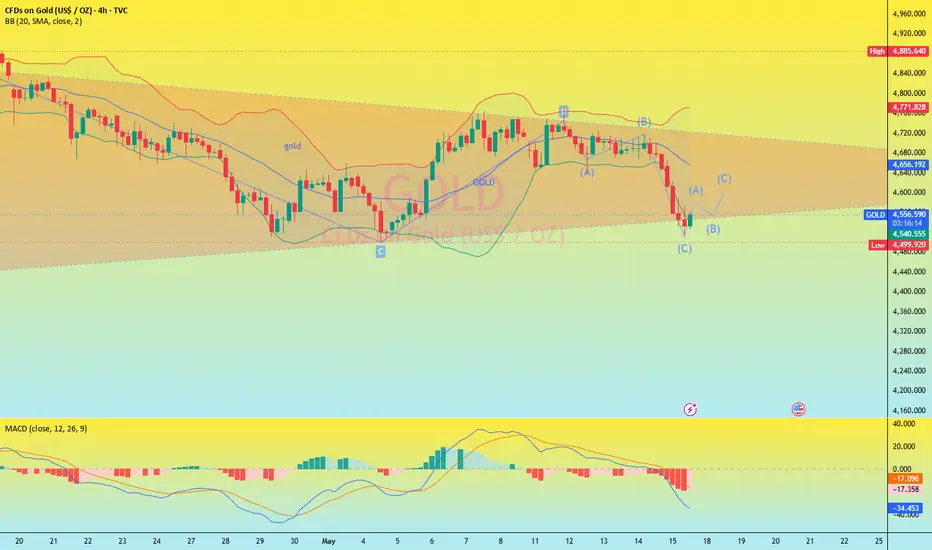
Based on the current daily chart, we can see several key changes:
Indicator signals:
RSI (14): The current reading is 39.81, having fallen below the 50 neutral line, indicating a weak zone. It has not yet entered the oversold zone, suggesting that downward momentum still has room to be released.
MACD (26,12,9): After the DIFF line (-24.98) and DEA line (-25.99) formed a death cross below the zero axis, although a brief golden cross occurred, the red bars continued to shorten. The current MACD value is only 2.03, indicating extremely weak rebound momentum, and the bearish dominance remains unchanged.
Moving average system turns bearish across the board: At the beginning of this week, gold prices failed to break through the key moving average resistance levels of MA20 (US$4662.75), MA50 (US$4729.37), and MA100 (US$4792.34). On Friday, it directly broke through the MA20 support, initiating an accelerated decline.
Key support level imminent: Gold prices touched a low of $4531.99 during the day, approaching the previously mentioned long-term 61.8% Fibonacci support level of $4541.88, only rebounding slightly at the end of the session.
Bullish/Bearish dividing line approaching: If the $4541.88 support level is breached, the next target is the $4515.33-$4491.84 retracement range. The $4481.78 level (a 20% retracement from the historical high) is the dividing line between a bull and bear market for gold; a break below this level would officially usher in a technical bear market for gold.
 XAUUSD XAUUSD
Indicator signals:
RSI (14): The current reading is 39.81, having fallen below the 50 neutral line, indicating a weak zone. It has not yet entered the oversold zone, suggesting that downward momentum still has room to be released.
MACD (26,12,9): After the DIFF line (-24.98) and DEA line (-25.99) formed a death cross below the zero axis, although a brief golden cross occurred, the red bars continued to shorten. The current MACD value is only 2.03, indicating extremely weak rebound momentum, and the bearish dominance remains unchanged.
Moving average system turns bearish across the board: At the beginning of this week, gold prices failed to break through the key moving average resistance levels of MA20 (US$4662.75), MA50 (US$4729.37), and MA100 (US$4792.34). On Friday, it directly broke through the MA20 support, initiating an accelerated decline.
Key support level imminent: Gold prices touched a low of $4531.99 during the day, approaching the previously mentioned long-term 61.8% Fibonacci support level of $4541.88, only rebounding slightly at the end of the session.
Bullish/Bearish dividing line approaching: If the $4541.88 support level is breached, the next target is the $4515.33-$4491.84 retracement range. The $4481.78 level (a 20% retracement from the historical high) is the dividing line between a bull and bear market for gold; a break below this level would officially usher in a technical bear market for gold.
XAUUSD XAUUSD Uwaga
Accurate trading signals are the only way to accumulate wealth.Uwaga
Please stay tuned or leave a message for detailed trading signals.Uwaga
Good luck to all traders.
Wyłączenie odpowiedzialności
Informacje i publikacje nie stanowią i nie powinny być traktowane jako porady finansowe, inwestycyjne, tradingowe ani jakiekolwiek inne rekomendacje dostarczane lub zatwierdzone przez TradingView. Więcej informacji znajduje się w Warunkach użytkowania.
Wyłączenie odpowiedzialności
Informacje i publikacje nie stanowią i nie powinny być traktowane jako porady finansowe, inwestycyjne, tradingowe ani jakiekolwiek inne rekomendacje dostarczane lub zatwierdzone przez TradingView. Więcej informacji znajduje się w Warunkach użytkowania.