
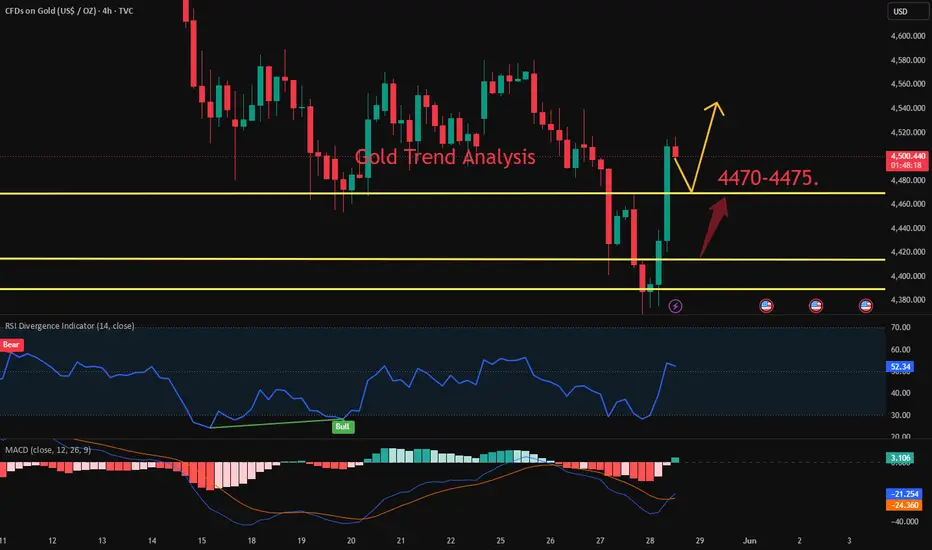
4-Hour Chart Analysis:
Gold has broken out of the $4460-70 supply zone, which has now turned into a short-term dynamic support level. The immediate resistance level is at $4530-4550—the very price range that triggered Wednesday's decline and sell-off.
Trading Strategy:
Buy at $4460-65
Add to your position gradually on pullbacks to $4420-25 (add to your position at this level)

Wyłączenie odpowiedzialności
Informacje i publikacje nie stanowią i nie powinny być traktowane jako porady finansowe, inwestycyjne, tradingowe ani jakiekolwiek inne rekomendacje dostarczane lub zatwierdzone przez TradingView. Więcej informacji znajduje się w Warunkach użytkowania.
Wyłączenie odpowiedzialności
Informacje i publikacje nie stanowią i nie powinny być traktowane jako porady finansowe, inwestycyjne, tradingowe ani jakiekolwiek inne rekomendacje dostarczane lub zatwierdzone przez TradingView. Więcej informacji znajduje się w Warunkach użytkowania.