
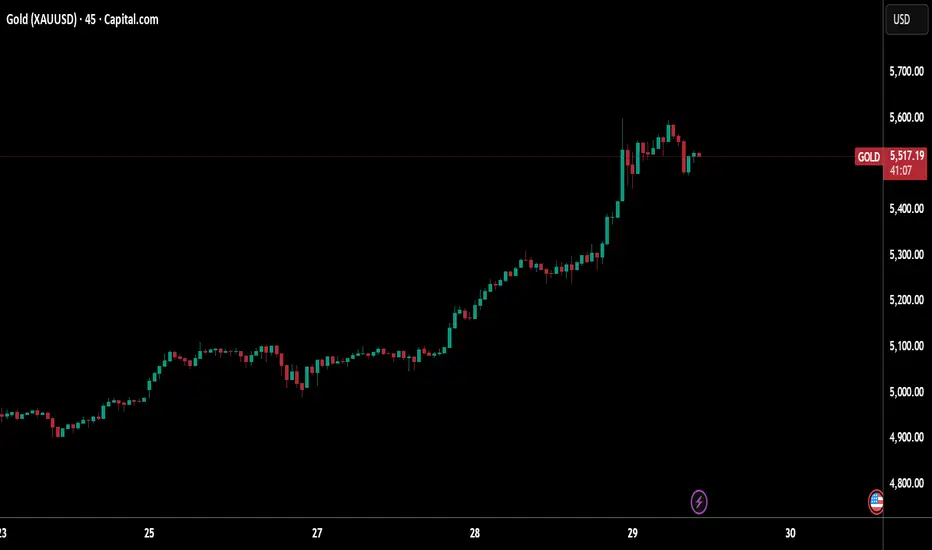
Trend: Clear bullish structure. Price is making higher highs and higher lows, supported by strong impulsive moves upward.
Key Demand Zones:
Major support: ~4,900–5,000 (bottom zone) — origin of the broader uptrend.
Intermediate demand: ~5,150–5,200 — previous consolidation and breakout base, now acting as support.
Current Price Action:
Price is trading just below a marked resistance zone (~5,520–5,560).
Rejection wicks at the top suggest selling pressure / profit-taking at resistance.
Resistance Zone:
The blue zone above current price is a supply / resistance area, where buyers are struggling to push through.
Pullback Scenario (Most Likely Short-Term):
A retracement into the support area around ~5,420 (red zone labeled “support area”) is likely.
This level aligns with prior structure and could act as a bullish retest.
Bullish Continuation Scenario:
If price holds above the support zone and shows bullish confirmation (strong bullish candle, rejection wick), continuation toward new highs above resistance is favored.
Invalidation / Deeper Correction:
A clean break and close below ~5,420 opens the door for a deeper pullback toward ~5,200 demand.
Bias Summary:
Short-term: Neutral to mildly bearish (pullback expected).
Medium-term: Bullish while price holds above key support zones.
Key Demand Zones:
Major support: ~4,900–5,000 (bottom zone) — origin of the broader uptrend.
Intermediate demand: ~5,150–5,200 — previous consolidation and breakout base, now acting as support.
Current Price Action:
Price is trading just below a marked resistance zone (~5,520–5,560).
Rejection wicks at the top suggest selling pressure / profit-taking at resistance.
Resistance Zone:
The blue zone above current price is a supply / resistance area, where buyers are struggling to push through.
Pullback Scenario (Most Likely Short-Term):
A retracement into the support area around ~5,420 (red zone labeled “support area”) is likely.
This level aligns with prior structure and could act as a bullish retest.
Bullish Continuation Scenario:
If price holds above the support zone and shows bullish confirmation (strong bullish candle, rejection wick), continuation toward new highs above resistance is favored.
Invalidation / Deeper Correction:
A clean break and close below ~5,420 opens the door for a deeper pullback toward ~5,200 demand.
Bias Summary:
Short-term: Neutral to mildly bearish (pullback expected).
Medium-term: Bullish while price holds above key support zones.

Wyłączenie odpowiedzialności
Informacje i publikacje nie stanowią i nie powinny być traktowane jako porady finansowe, inwestycyjne, tradingowe ani jakiekolwiek inne rekomendacje dostarczane lub zatwierdzone przez TradingView. Więcej informacji znajduje się w Warunkach użytkowania.
Wyłączenie odpowiedzialności
Informacje i publikacje nie stanowią i nie powinny być traktowane jako porady finansowe, inwestycyjne, tradingowe ani jakiekolwiek inne rekomendacje dostarczane lub zatwierdzone przez TradingView. Więcej informacji znajduje się w Warunkach użytkowania.