
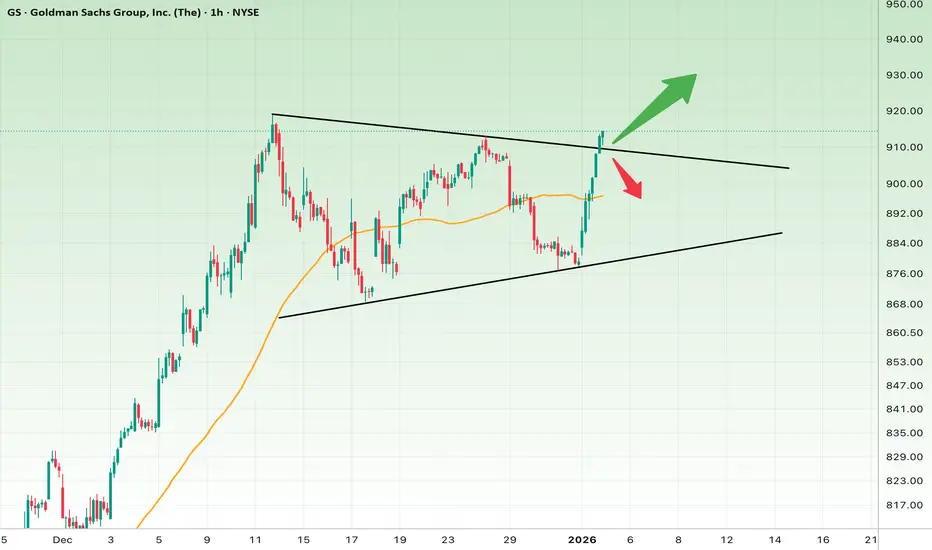
GS price is currently moving inside a Rising Wedge pattern — a structure that is inherently risky and often associated with corrective moves, especially near the upper boundary.
At the moment:
• Price has made a strong push into the upper trendline
• The moving average (orange line) has been reclaimed as support
• However, there is no confirmed and sustained breakout above resistance yet
This places the market at a critical smart-money decision zone.
Trading Scenarios
Bullish Scenario (Valid Breakout)
If price:
• Holds and closes above the 915–920 zone
• Shows acceptance above the wedge (no deep pullback)
Then a confirmed breakout is in play.
Upside Targets:
930 → 950
Invalidation / Stop-loss:
Hourly close below 905
Bearish Scenario (Fake Breakout / Rejection)
If price:
• Fails to hold above the upper trendline
• Falls back inside the wedge structure
This would activate a classic fake breakout scenario.
Downside Targets:
895 → 880 (wedge support)
Short invalidation:
Hourly close above 920
Structural / Behavioral View
• The sharp upside move may represent a liquidity grab
• Rising wedges near highs often resolve to the downside
• Still, the breakout candle strength suggests sellers are currently weak
Key takeaway:
Confirmation matters more than prediction
Fundamental Context (Brief)
Goldman Sachs continues to benefit from:
• Strong trading and investment banking revenue
• Increased market volatility
• A dominant position in capital markets
That said, the stock is trading at elevated valuation levels, making short-term pullbacks completely normal.
Final Summary
GS is sitting right at a major resistance zone:
• Acceptance above 920 → bullish continuation
• Rejection → controlled correction
Best strategy:
• Trade after confirmation, not inside the pattern
At the moment:
• Price has made a strong push into the upper trendline
• The moving average (orange line) has been reclaimed as support
• However, there is no confirmed and sustained breakout above resistance yet
This places the market at a critical smart-money decision zone.
Trading Scenarios
Bullish Scenario (Valid Breakout)
If price:
• Holds and closes above the 915–920 zone
• Shows acceptance above the wedge (no deep pullback)
Then a confirmed breakout is in play.
Upside Targets:
930 → 950
Invalidation / Stop-loss:
Hourly close below 905
Bearish Scenario (Fake Breakout / Rejection)
If price:
• Fails to hold above the upper trendline
• Falls back inside the wedge structure
This would activate a classic fake breakout scenario.
Downside Targets:
895 → 880 (wedge support)
Short invalidation:
Hourly close above 920
Structural / Behavioral View
• The sharp upside move may represent a liquidity grab
• Rising wedges near highs often resolve to the downside
• Still, the breakout candle strength suggests sellers are currently weak
Key takeaway:
Confirmation matters more than prediction
Fundamental Context (Brief)
Goldman Sachs continues to benefit from:
• Strong trading and investment banking revenue
• Increased market volatility
• A dominant position in capital markets
That said, the stock is trading at elevated valuation levels, making short-term pullbacks completely normal.
Final Summary
GS is sitting right at a major resistance zone:
• Acceptance above 920 → bullish continuation
• Rejection → controlled correction
Best strategy:
• Trade after confirmation, not inside the pattern

Wyłączenie odpowiedzialności
Informacje i publikacje nie stanowią i nie powinny być traktowane jako porady finansowe, inwestycyjne, tradingowe ani jakiekolwiek inne rekomendacje dostarczane lub zatwierdzone przez TradingView. Więcej informacji znajduje się w Warunkach użytkowania.
Wyłączenie odpowiedzialności
Informacje i publikacje nie stanowią i nie powinny być traktowane jako porady finansowe, inwestycyjne, tradingowe ani jakiekolwiek inne rekomendacje dostarczane lub zatwierdzone przez TradingView. Więcej informacji znajduje się w Warunkach użytkowania.