
⚡ STOCK TO WATCH ⚡
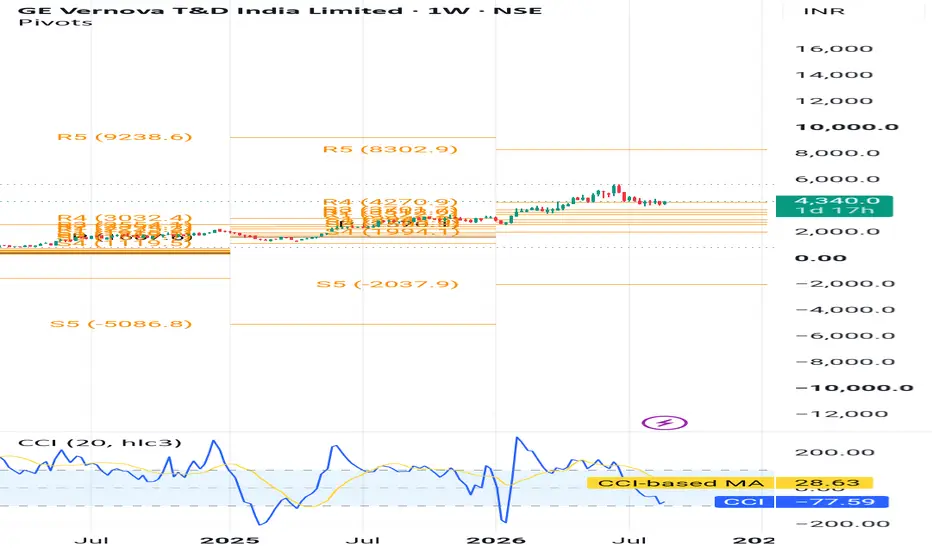
₹4,270–₹4,300 → ₹8,302 → ₹9,236 👀
A high-quality power-transmission play appearing on my Weekly R4 Momentum Breakout Scanner.
GE Vernova T&D India Ltd.
📌 Buy Zone: ₹4,270–₹4,300
📌 Breakout Zone: ₹4,270
🛑 Stop Loss: ₹3,322
🎯 Target 1: ₹8,302
🎯 Target 2: ₹9,236
Why GE Vernova T&D India?
⚡ Power T&D leader: The company provides transformers, switchgear, grid solutions, HVDC and other transmission & distribution technologies.
📈 Strong Q1 FY27 growth: Revenue increased 38% YoY to ₹1,840 Cr, while PAT rose 25% to ₹360 Cr.
🏗️ Large order backlog: The order backlog stood around ₹20,900 Cr, providing significant multi-year revenue visibility.
🇮🇳 India's power-infrastructure opportunity: Grid modernisation, rising electricity demand, renewable integration and transmission investment provide a long-term structural growth runway.
🔧 Capacity expansion: Management is investing in capabilities across HVDC, transformers, reactors, gas-insulated switchgear and other grid technologies.
Why It Caught My Attention
✅ 38% Q1 revenue growth
✅ 25% PAT growth
✅ ~₹20,900 Cr order backlog
✅ Critical power-transmission infrastructure play
✅ Energy-transition beneficiary
✅ Strong multi-year execution visibility
✅ Weekly R4 Momentum Breakout
⚠️ Important: Q1 was operationally strong, but EBITDA margin contracted by roughly 400 bps YoY, and Q1 order bookings declined 30% YoY. The large existing backlog is the key cushion, but fresh order momentum needs monitoring.
Risk Defined. Reward Visible.
📢 Disclaimer: This content is for educational purposes only and not investment advice. Please do your own due diligence before making any investment decisions.
© 20K Microcap Investing | R4 Momentum Desk
#GEVernova #GEVernovaTD #GVTandD #PowerStocks #TransmissionStocks #PowerInfrastructure #EnergyTransition #InfrastructureStocks #StockMarketIndia #IndianStocks #StocksToWatch #R4Breakout #MomentumInvesting #20KMicrocap
₹4,270–₹4,300 → ₹8,302 → ₹9,236 👀
A high-quality power-transmission play appearing on my Weekly R4 Momentum Breakout Scanner.
GE Vernova T&D India Ltd.
📌 Buy Zone: ₹4,270–₹4,300
📌 Breakout Zone: ₹4,270
🛑 Stop Loss: ₹3,322
🎯 Target 1: ₹8,302
🎯 Target 2: ₹9,236
Why GE Vernova T&D India?
⚡ Power T&D leader: The company provides transformers, switchgear, grid solutions, HVDC and other transmission & distribution technologies.
📈 Strong Q1 FY27 growth: Revenue increased 38% YoY to ₹1,840 Cr, while PAT rose 25% to ₹360 Cr.
🏗️ Large order backlog: The order backlog stood around ₹20,900 Cr, providing significant multi-year revenue visibility.
🇮🇳 India's power-infrastructure opportunity: Grid modernisation, rising electricity demand, renewable integration and transmission investment provide a long-term structural growth runway.
🔧 Capacity expansion: Management is investing in capabilities across HVDC, transformers, reactors, gas-insulated switchgear and other grid technologies.
Why It Caught My Attention
✅ 38% Q1 revenue growth
✅ 25% PAT growth
✅ ~₹20,900 Cr order backlog
✅ Critical power-transmission infrastructure play
✅ Energy-transition beneficiary
✅ Strong multi-year execution visibility
✅ Weekly R4 Momentum Breakout
⚠️ Important: Q1 was operationally strong, but EBITDA margin contracted by roughly 400 bps YoY, and Q1 order bookings declined 30% YoY. The large existing backlog is the key cushion, but fresh order momentum needs monitoring.
Risk Defined. Reward Visible.
📢 Disclaimer: This content is for educational purposes only and not investment advice. Please do your own due diligence before making any investment decisions.
© 20K Microcap Investing | R4 Momentum Desk
#GEVernova #GEVernovaTD #GVTandD #PowerStocks #TransmissionStocks #PowerInfrastructure #EnergyTransition #InfrastructureStocks #StockMarketIndia #IndianStocks #StocksToWatch #R4Breakout #MomentumInvesting #20KMicrocap

Wyłączenie odpowiedzialności
Informacje i publikacje nie stanowią i nie powinny być traktowane jako porady finansowe, inwestycyjne, tradingowe ani jakiekolwiek inne rekomendacje dostarczane lub zatwierdzone przez TradingView. Więcej informacji znajduje się w Warunkach użytkowania.
Wyłączenie odpowiedzialności
Informacje i publikacje nie stanowią i nie powinny być traktowane jako porady finansowe, inwestycyjne, tradingowe ani jakiekolwiek inne rekomendacje dostarczane lub zatwierdzone przez TradingView. Więcej informacji znajduje się w Warunkach użytkowania.