
HANA / USDT — Long Accumulation Base & Early Expansion
Hey there something is cooking :-)
January 28, 2026
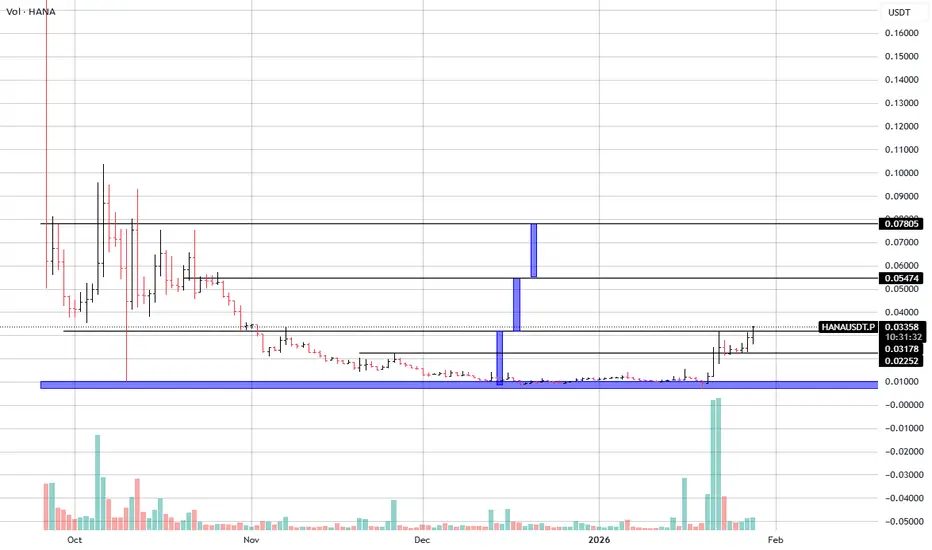
HANA is coming from a very deep drawdown phase and is now showing the first meaningful signs of structural recovery after months of base building near the lows.
This is a classic post-capitulation accumulation setup, where volatility compresses before a potential trend reversal.
🔍 Technical Overview
Current price: ~$0.033–0.034
Price has recently lifted off the absolute bottom, reclaiming short-term structure and printing higher lows for the first time since the downtrend began.
Volume has expanded sharply during the latest push — a key signal that demand is finally stepping in after a long period of apathy.
📊 Market Structure Breakdown
1. Prolonged downtrend & capitulation
HANA spent several months in a persistent downtrend, eventually collapsing into a flat base around $0.010–0.012.
This zone represents:
Maximum pessimism
Forced selling exhaustion
Long-term demand absorption
The flat behavior here strongly suggests capitulation rather than distribution.
2. Multi-week accumulation at the lows
After bottoming, price moved sideways for weeks with:
Extremely low volatility
Declining sell volume
Tight daily ranges
This is typical smart-money accumulation behavior, where positions are built quietly before any expansion.
3. First impulsive reclaim
The recent impulse broke price above:
The base range
Local resistances
Short-term value area
This marks a transition from accumulation to early expansion, not yet a full trend — but an important regime shift.
🧱 Key Levels
Major Support Zones
$0.022–0.025 → first structural support after breakout
$0.010–0.012 → macro bottom / accumulation base
Losing the base would invalidate the setup, but as long as price holds above ~$0.022, structure remains constructive.
Resistance & Upside Targets
$0.034–0.036 → current acceptance zone
$0.054–0.055 → major prior breakdown level
$0.078–0.080 → high-timeframe supply & historical resistance
These levels align with previous inefficiencies created during the distribution phase.
🎯 Outlook & Scenarios
Bullish Case
Hold above $0.030–0.032
Acceptance above $0.036
If confirmed, price could rotate toward $0.054 first, with extension potential toward $0.078 if momentum accelerates.
Bearish / Invalidation
Loss of $0.022
Acceptance back into the base
This would signal that accumulation is incomplete and delay expansion.
🧠 Final Thought
HANA is not in a hype phase — and that’s exactly what makes the structure interesting.
This is an early-stage recovery setup:
Deep base
Clear capitulation
First impulse supported by volume
If continuation follows, HANA could transition from dead-chart behavior to trend development over the coming weeks.
have a nice trading week
January 28, 2026
HANA is coming from a very deep drawdown phase and is now showing the first meaningful signs of structural recovery after months of base building near the lows.
This is a classic post-capitulation accumulation setup, where volatility compresses before a potential trend reversal.
🔍 Technical Overview
Current price: ~$0.033–0.034
Price has recently lifted off the absolute bottom, reclaiming short-term structure and printing higher lows for the first time since the downtrend began.
Volume has expanded sharply during the latest push — a key signal that demand is finally stepping in after a long period of apathy.
📊 Market Structure Breakdown
1. Prolonged downtrend & capitulation
HANA spent several months in a persistent downtrend, eventually collapsing into a flat base around $0.010–0.012.
This zone represents:
Maximum pessimism
Forced selling exhaustion
Long-term demand absorption
The flat behavior here strongly suggests capitulation rather than distribution.
2. Multi-week accumulation at the lows
After bottoming, price moved sideways for weeks with:
Extremely low volatility
Declining sell volume
Tight daily ranges
This is typical smart-money accumulation behavior, where positions are built quietly before any expansion.
3. First impulsive reclaim
The recent impulse broke price above:
The base range
Local resistances
Short-term value area
This marks a transition from accumulation to early expansion, not yet a full trend — but an important regime shift.
🧱 Key Levels
Major Support Zones
$0.022–0.025 → first structural support after breakout
$0.010–0.012 → macro bottom / accumulation base
Losing the base would invalidate the setup, but as long as price holds above ~$0.022, structure remains constructive.
Resistance & Upside Targets
$0.034–0.036 → current acceptance zone
$0.054–0.055 → major prior breakdown level
$0.078–0.080 → high-timeframe supply & historical resistance
These levels align with previous inefficiencies created during the distribution phase.
🎯 Outlook & Scenarios
Bullish Case
Hold above $0.030–0.032
Acceptance above $0.036
If confirmed, price could rotate toward $0.054 first, with extension potential toward $0.078 if momentum accelerates.
Bearish / Invalidation
Loss of $0.022
Acceptance back into the base
This would signal that accumulation is incomplete and delay expansion.
🧠 Final Thought
HANA is not in a hype phase — and that’s exactly what makes the structure interesting.
This is an early-stage recovery setup:
Deep base
Clear capitulation
First impulse supported by volume
If continuation follows, HANA could transition from dead-chart behavior to trend development over the coming weeks.
have a nice trading week
Zlecenie aktywne
still active, a very slow uptrend .
Who Dares always Wins!
My contact on Telegram: @Etelve
My contact on Telegram: @Etelve
Wyłączenie odpowiedzialności
Informacje i publikacje nie stanowią i nie powinny być traktowane jako porady finansowe, inwestycyjne, tradingowe ani jakiekolwiek inne rekomendacje dostarczane lub zatwierdzone przez TradingView. Więcej informacji znajduje się w Warunkach użytkowania.
Who Dares always Wins!
My contact on Telegram: @Etelve
My contact on Telegram: @Etelve
Wyłączenie odpowiedzialności
Informacje i publikacje nie stanowią i nie powinny być traktowane jako porady finansowe, inwestycyjne, tradingowe ani jakiekolwiek inne rekomendacje dostarczane lub zatwierdzone przez TradingView. Więcej informacji znajduje się w Warunkach użytkowania.