Long
HAPI Bottomed?
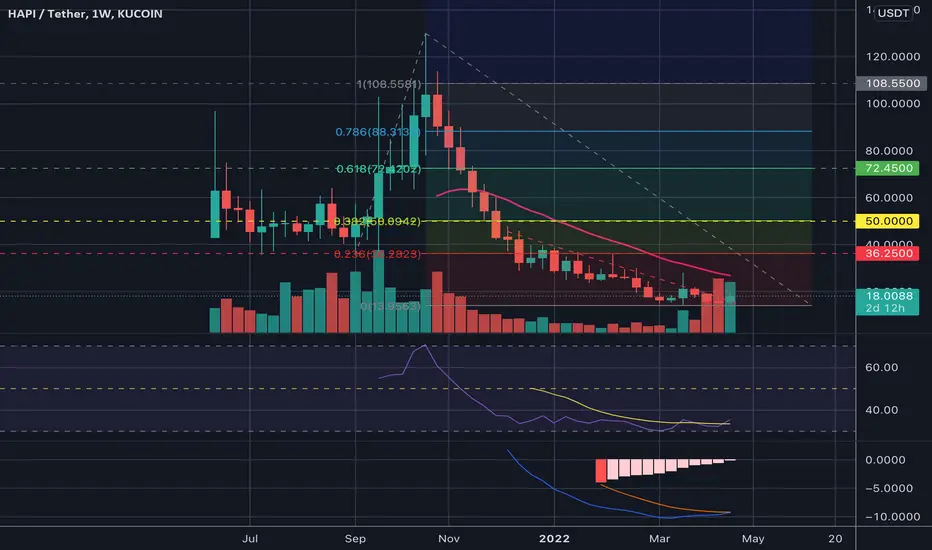
HAPI/USD (Weekly)
- Seem to have found Support at approx. the $15-16 area and range-bound for a while.
- MACD/Signal and Histogram reversing
- Volume increasing over the last 3 weeks
- RSI low reversing
- Looks to be closing above the 50MA on the daily
- Resistance levels marked out by the fib extension (String Resistance will be at $50 and approx $72 area. If we can break above with strength, we should be forming a new high.
- Strong Resistance at the $50 level shown by the Volume Profile
- Seem to have found Support at approx. the $15-16 area and range-bound for a while.
- MACD/Signal and Histogram reversing
- Volume increasing over the last 3 weeks
- RSI low reversing
- Looks to be closing above the 50MA on the daily
- Resistance levels marked out by the fib extension (String Resistance will be at $50 and approx $72 area. If we can break above with strength, we should be forming a new high.
- Strong Resistance at the $50 level shown by the Volume Profile

Wyłączenie odpowiedzialności
Informacje i publikacje nie stanowią i nie powinny być traktowane jako porady finansowe, inwestycyjne, tradingowe ani jakiekolwiek inne rekomendacje dostarczane lub zatwierdzone przez TradingView. Więcej informacji znajduje się w Warunkach użytkowania.
Wyłączenie odpowiedzialności
Informacje i publikacje nie stanowią i nie powinny być traktowane jako porady finansowe, inwestycyjne, tradingowe ani jakiekolwiek inne rekomendacje dostarczane lub zatwierdzone przez TradingView. Więcej informacji znajduje się w Warunkach użytkowania.