
📌 Current Price (Reference)
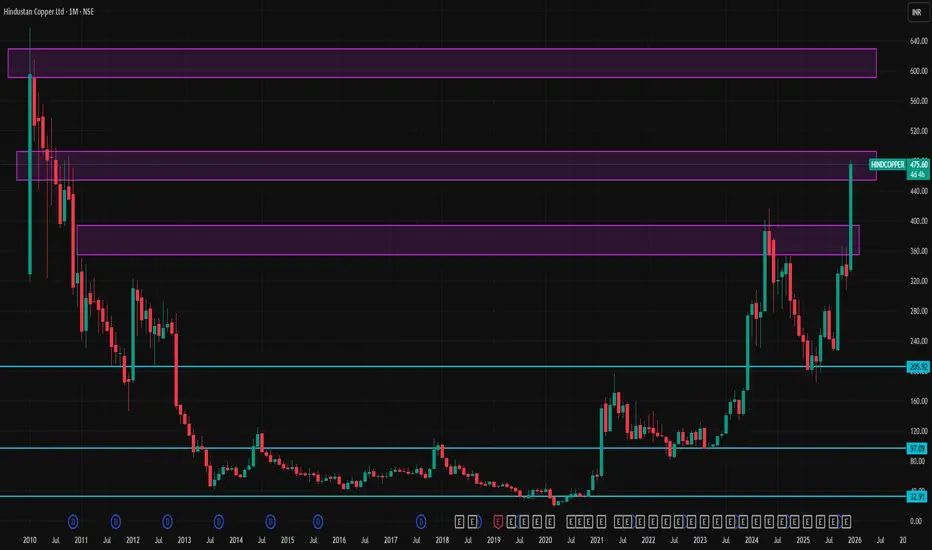
The stock is trading near ~₹475–₹480 on NSE/BSE (Dec 2025 close).
📊 Key Levels for ~1‑Month Time Frame
🔵 Bullish / Resistance Levels
These are potential upside barriers where price may slow or reverse:
1. ~₹490–₹495 — Near recent pivot resistance zone.
2. ~₹500–₹505 — Mid‑term resistance zone (psychological/technical).
3. ~₹525–₹530 — Extended upside if momentum remains strong.
Interpretation: If price sustains above ₹490–₹495, it may attempt to test ₹500–₹530. A breakout above these zones could fuel further bullish sentiment.
🔴 Bearish / Support Levels
Important floors where buyers may step in on dips:
1. ~₹452–₹455 — Near immediate support (recent pivot low).
2. ~₹428–₹430 — Secondary support zone.
3. ~₹415–₹420 — Major support; breach could signal deeper correction.
Interpretation: If the stock drops below ₹452–₹455, watch for holds around ₹428–₹430, then ₹415–₹420. A failure to hold these levels could lead to broader consolidation.
🧠 How to Use These Levels
Range traders might look to take profit near resistance zones and buy near established supports.
Breakouts above ₹500 with volume could open room toward the ₹525–₹530 area.
Downside breaks under ~₹452 might see a pullback toward ₹428 and lower supports.
The stock is trading near ~₹475–₹480 on NSE/BSE (Dec 2025 close).
📊 Key Levels for ~1‑Month Time Frame
🔵 Bullish / Resistance Levels
These are potential upside barriers where price may slow or reverse:
1. ~₹490–₹495 — Near recent pivot resistance zone.
2. ~₹500–₹505 — Mid‑term resistance zone (psychological/technical).
3. ~₹525–₹530 — Extended upside if momentum remains strong.
Interpretation: If price sustains above ₹490–₹495, it may attempt to test ₹500–₹530. A breakout above these zones could fuel further bullish sentiment.
🔴 Bearish / Support Levels
Important floors where buyers may step in on dips:
1. ~₹452–₹455 — Near immediate support (recent pivot low).
2. ~₹428–₹430 — Secondary support zone.
3. ~₹415–₹420 — Major support; breach could signal deeper correction.
Interpretation: If the stock drops below ₹452–₹455, watch for holds around ₹428–₹430, then ₹415–₹420. A failure to hold these levels could lead to broader consolidation.
🧠 How to Use These Levels
Range traders might look to take profit near resistance zones and buy near established supports.
Breakouts above ₹500 with volume could open room toward the ₹525–₹530 area.
Downside breaks under ~₹452 might see a pullback toward ₹428 and lower supports.

Contact Knowledgehub for a detailed consultation: Dm on WhatsApp: [wa.link/a2o0kz]-
Phone No: [+91 93102 26243]-
Email: [tradingviewknowledgehub@gmail.com]---
-- Let’s achieve success together!
Phone No: [+91 93102 26243]-
Email: [tradingviewknowledgehub@gmail.com]---
-- Let’s achieve success together!
Powiązane publikacje
Wyłączenie odpowiedzialności
Informacje i publikacje nie stanowią i nie powinny być traktowane jako porady finansowe, inwestycyjne, tradingowe ani jakiekolwiek inne rekomendacje dostarczane lub zatwierdzone przez TradingView. Więcej informacji znajduje się w Warunkach użytkowania.
Contact Knowledgehub for a detailed consultation: Dm on WhatsApp: [wa.link/a2o0kz]-
Phone No: [+91 93102 26243]-
Email: [tradingviewknowledgehub@gmail.com]---
-- Let’s achieve success together!
Phone No: [+91 93102 26243]-
Email: [tradingviewknowledgehub@gmail.com]---
-- Let’s achieve success together!
Powiązane publikacje
Wyłączenie odpowiedzialności
Informacje i publikacje nie stanowią i nie powinny być traktowane jako porady finansowe, inwestycyjne, tradingowe ani jakiekolwiek inne rekomendacje dostarczane lub zatwierdzone przez TradingView. Więcej informacji znajduje się w Warunkach użytkowania.