
📊 HINDUNILVR – Technical & Educational Snapshot
Ticker: NSE: HINDUNILVR
Sector: 🛒 FMCG & Consumer Staples
CMP: 2,121.50 ▲ (+2.02%)
Learning Rating: ⭐⭐⭐⭐☆ (Demand Zone Recovery Observation)
Chart Pattern Observed: 📦 Consolidation Near Demand Zone
Candlestick Pattern Observed: 🟢 Bullish Recovery Candle
━━━━━━━━━━━━━━━━━━━
📊 Technical Snapshot
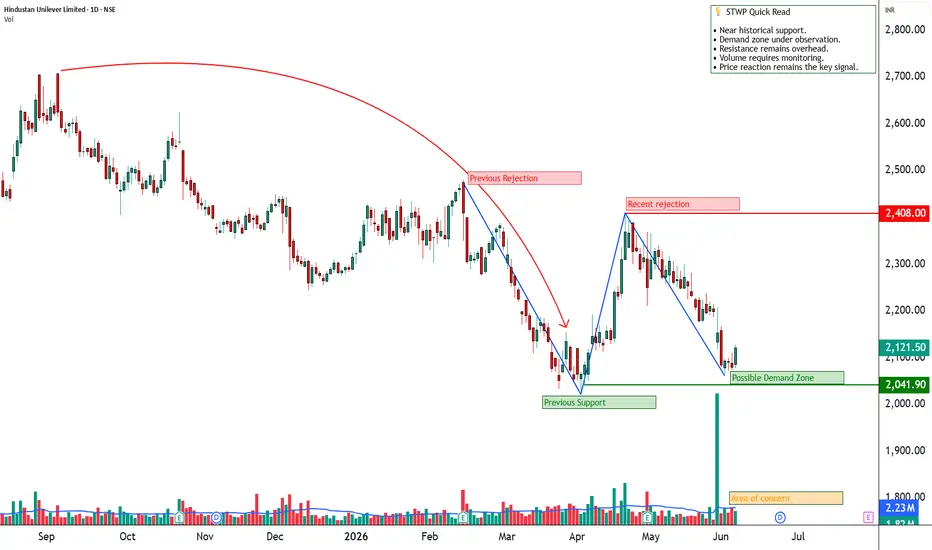
HINDUNILVR is currently trading near a recently identified Daily Demand Zone after experiencing a prolonged corrective phase from higher levels. The latest candle reflects improved buying participation around support, resulting in a recovery attempt within the broader consolidation structure. Price remains below key resistance areas, indicating that the larger trend continues to be in a stabilization phase rather than a confirmed upward trend.
RSI is positioned near the 40 zone, reflecting improving momentum conditions after a period of weakness. MACD remains below the zero line, suggesting that the broader structure continues to face pressure, although downside momentum has moderated in recent sessions. Bollinger Bands remain relatively compressed, indicating contained volatility and a market that is still searching for directional clarity. Overall, the structure currently reflects consolidation with signs of stabilization near support.
━━━━━━━━━━━━━━━━━━━
📊 Volume Analysis
🔹 Current Volume: ~1.82M
🔹 Average Volume (20-period): ~2.23M
📈 Current participation remains below the recent average, indicating that activity levels have not expanded significantly during the recovery phase.
💡 Interpretation: Recovery attempts accompanied by stable participation near support may indicate improving sentiment. However, stronger participation often provides additional confirmation regarding the sustainability of price movements.
━━━━━━━━━━━━━━━━━━━
🔑 Key Levels – Daily Timeframe
Support Areas: 2089.97 | 2058.43 | 2039.67
Resistance Areas: 2140.27 | 2159.03 | 2190.57
These are observation zones where price has reacted previously.
━━━━━━━━━━━━━━━━━━━
📊 STWP Structural Readings
The STWP Structural Readings currently classify HINDUNILVR as being in a Consolidation State while trading within the Lower Range of its broader market structure. The stock has remained inside a wide trading band between 2041.9 and 2408 for approximately 1 Month and 12 Days, reflecting an extended phase of balance between buyers and sellers.
The prevailing structure remains Bearish, although recent price behaviour suggests stabilization near support. Price is also approaching the 23.6% Fibonacci observation level near 2128.3, making this an important area to monitor for further structural development and market reaction.
━━━━━━━━━━━━━━━━━━━
📊 Demand Zone Readings
Type: DBR Demand
High: 2110.90
Low: 2065.70
Range: 45.20
Status: Fresh
The active demand zone is classified as a Fresh DBR (Drop–Base–Rally) Demand Zone, indicating a prior area of notable buying participation. Since the zone remains fresh and has not undergone multiple retests, its structural relevance remains intact.
The relatively narrow 45-point range reflects a clearly defined accumulation area where buyers previously absorbed available supply. Continued price stability around this region would suggest that the demand zone remains active from a chart-reading perspective.
💡 STWP Observation: Fresh demand zones often remain important observation areas because they represent locations where market participants previously displayed strong buying interest.
━━━━━━━━━━━━━━━━━━━
📉 Probable Pullback Zones (Chart-Based Observation)
Healthy Pullback Zone: 2105 – 2089
Demand Observation Zone: 2089 – 2065
Deep Pullback Observation Zone: 2065 – 2039
💡 These zones represent areas where price has previously shown activity and may be monitored for future market reactions.
━━━━━━━━━━━━━━━━━━━
What's Catching Our Eye: Price is stabilizing near a fresh demand zone after an extended corrective phase.
What to Watch For: Price behaviour near the 2140–2159 resistance cluster.
Structure Weakness Zone: Sustained trading below the demand region may alter the current recovery observation.
Risks to Watch: Continued lower-than-average participation may limit the strength of recovery attempts.
What to Expect Next: Consolidation with potential testing of nearby resistance zones while price remains above support areas.
━━━━━━━━━━━━━━━━━━━
STWP Equity Snapshot – HINDUNILVR
Reference Framework
Reference Area: 2127.50
Structure Observation Level: 2069.60
Higher Observation Area 1: 2185.40
Higher Observation Area 2: 2243.30
━━━━━━━━━━━━━━━━━━━
STWP View
• Sentiment: Recovery Observation | Trend: Consolidation
• RSI: 39.98 (Recovering Momentum Conditions)
• Volume: Below Average Participation
• Structure: Consolidation Near Fresh Demand Zone
━━━━━━━━━━━━━━━━━━━
Final Outlook
Momentum: Improving
Trend: Consolidation
Risk: Moderate
Volume: Below Average
The stock is currently exhibiting signs of stabilization near an identified demand area while remaining inside a broader consolidation structure. Future market behaviour around support and resistance clusters may provide additional information regarding the next phase of the ongoing structure.
━━━━━━━━━━━━━━━━━━━
💡 Learning Note
Demand zones highlight areas where notable buying activity may have occurred previously. However, chart interpretation becomes more meaningful when demand zones are evaluated alongside price structure, participation levels, and reactions around important observation areas.
━━━━━━━━━━━━━━━━━━━
⚠️ Disclaimer:
This analysis is generated strictly for educational, informational, and market-learning purposes only.
The observations presented are based on chart structure, technical indicators, and historical price behaviour. They should not be construed as investment advice, trading advice, research recommendations, or a solicitation to buy or sell any security.
Markets involve risk, and past price behaviour does not guarantee future outcomes. Readers should exercise independent judgment and consult a SEBI-registered investment adviser or financial professional before making any investment or trading decisions.
STWP assumes no responsibility for any financial outcome arising from the use of this educational content.
━━━━━━━━━━━━━━━━━━━
💬 Consolidation near demand or beginning of a stronger recovery phase — what does the structure suggest to you?
🔼 Boost | ✍️ Comment | 🔁 Share with fellow learners
👉 Follow STWP for clean chart-reading insights
🚀 Stay Calm. Stay Clean. Trade With Patience.
Ticker: NSE: HINDUNILVR
Sector: 🛒 FMCG & Consumer Staples
CMP: 2,121.50 ▲ (+2.02%)
Learning Rating: ⭐⭐⭐⭐☆ (Demand Zone Recovery Observation)
Chart Pattern Observed: 📦 Consolidation Near Demand Zone
Candlestick Pattern Observed: 🟢 Bullish Recovery Candle
━━━━━━━━━━━━━━━━━━━
📊 Technical Snapshot
HINDUNILVR is currently trading near a recently identified Daily Demand Zone after experiencing a prolonged corrective phase from higher levels. The latest candle reflects improved buying participation around support, resulting in a recovery attempt within the broader consolidation structure. Price remains below key resistance areas, indicating that the larger trend continues to be in a stabilization phase rather than a confirmed upward trend.
RSI is positioned near the 40 zone, reflecting improving momentum conditions after a period of weakness. MACD remains below the zero line, suggesting that the broader structure continues to face pressure, although downside momentum has moderated in recent sessions. Bollinger Bands remain relatively compressed, indicating contained volatility and a market that is still searching for directional clarity. Overall, the structure currently reflects consolidation with signs of stabilization near support.
━━━━━━━━━━━━━━━━━━━
📊 Volume Analysis
🔹 Current Volume: ~1.82M
🔹 Average Volume (20-period): ~2.23M
📈 Current participation remains below the recent average, indicating that activity levels have not expanded significantly during the recovery phase.
💡 Interpretation: Recovery attempts accompanied by stable participation near support may indicate improving sentiment. However, stronger participation often provides additional confirmation regarding the sustainability of price movements.
━━━━━━━━━━━━━━━━━━━
🔑 Key Levels – Daily Timeframe
Support Areas: 2089.97 | 2058.43 | 2039.67
Resistance Areas: 2140.27 | 2159.03 | 2190.57
These are observation zones where price has reacted previously.
━━━━━━━━━━━━━━━━━━━
📊 STWP Structural Readings
The STWP Structural Readings currently classify HINDUNILVR as being in a Consolidation State while trading within the Lower Range of its broader market structure. The stock has remained inside a wide trading band between 2041.9 and 2408 for approximately 1 Month and 12 Days, reflecting an extended phase of balance between buyers and sellers.
The prevailing structure remains Bearish, although recent price behaviour suggests stabilization near support. Price is also approaching the 23.6% Fibonacci observation level near 2128.3, making this an important area to monitor for further structural development and market reaction.
━━━━━━━━━━━━━━━━━━━
📊 Demand Zone Readings
Type: DBR Demand
High: 2110.90
Low: 2065.70
Range: 45.20
Status: Fresh
The active demand zone is classified as a Fresh DBR (Drop–Base–Rally) Demand Zone, indicating a prior area of notable buying participation. Since the zone remains fresh and has not undergone multiple retests, its structural relevance remains intact.
The relatively narrow 45-point range reflects a clearly defined accumulation area where buyers previously absorbed available supply. Continued price stability around this region would suggest that the demand zone remains active from a chart-reading perspective.
💡 STWP Observation: Fresh demand zones often remain important observation areas because they represent locations where market participants previously displayed strong buying interest.
━━━━━━━━━━━━━━━━━━━
📉 Probable Pullback Zones (Chart-Based Observation)
Healthy Pullback Zone: 2105 – 2089
Demand Observation Zone: 2089 – 2065
Deep Pullback Observation Zone: 2065 – 2039
💡 These zones represent areas where price has previously shown activity and may be monitored for future market reactions.
━━━━━━━━━━━━━━━━━━━
What's Catching Our Eye: Price is stabilizing near a fresh demand zone after an extended corrective phase.
What to Watch For: Price behaviour near the 2140–2159 resistance cluster.
Structure Weakness Zone: Sustained trading below the demand region may alter the current recovery observation.
Risks to Watch: Continued lower-than-average participation may limit the strength of recovery attempts.
What to Expect Next: Consolidation with potential testing of nearby resistance zones while price remains above support areas.
━━━━━━━━━━━━━━━━━━━
STWP Equity Snapshot – HINDUNILVR
Reference Framework
Reference Area: 2127.50
Structure Observation Level: 2069.60
Higher Observation Area 1: 2185.40
Higher Observation Area 2: 2243.30
━━━━━━━━━━━━━━━━━━━
STWP View
• Sentiment: Recovery Observation | Trend: Consolidation
• RSI: 39.98 (Recovering Momentum Conditions)
• Volume: Below Average Participation
• Structure: Consolidation Near Fresh Demand Zone
━━━━━━━━━━━━━━━━━━━
Final Outlook
Momentum: Improving
Trend: Consolidation
Risk: Moderate
Volume: Below Average
The stock is currently exhibiting signs of stabilization near an identified demand area while remaining inside a broader consolidation structure. Future market behaviour around support and resistance clusters may provide additional information regarding the next phase of the ongoing structure.
━━━━━━━━━━━━━━━━━━━
💡 Learning Note
Demand zones highlight areas where notable buying activity may have occurred previously. However, chart interpretation becomes more meaningful when demand zones are evaluated alongside price structure, participation levels, and reactions around important observation areas.
━━━━━━━━━━━━━━━━━━━
⚠️ Disclaimer:
This analysis is generated strictly for educational, informational, and market-learning purposes only.
The observations presented are based on chart structure, technical indicators, and historical price behaviour. They should not be construed as investment advice, trading advice, research recommendations, or a solicitation to buy or sell any security.
Markets involve risk, and past price behaviour does not guarantee future outcomes. Readers should exercise independent judgment and consult a SEBI-registered investment adviser or financial professional before making any investment or trading decisions.
STWP assumes no responsibility for any financial outcome arising from the use of this educational content.
━━━━━━━━━━━━━━━━━━━
💬 Consolidation near demand or beginning of a stronger recovery phase — what does the structure suggest to you?
🔼 Boost | ✍️ Comment | 🔁 Share with fellow learners
👉 Follow STWP for clean chart-reading insights
🚀 Stay Calm. Stay Clean. Trade With Patience.

STWP | Mentor & Demand-Supply Specialist |
Empowering traders through structured learning |
simpletradewithpatience.com
chat.whatsapp.com/HaFVOsLKriN8wxmlBMbqgf
wa.me/message/6IOPHGOXMGZ4N1
Educational Only
Empowering traders through structured learning |
simpletradewithpatience.com
chat.whatsapp.com/HaFVOsLKriN8wxmlBMbqgf
wa.me/message/6IOPHGOXMGZ4N1
Educational Only
Wyłączenie odpowiedzialności
Informacje i publikacje nie stanowią i nie powinny być traktowane jako porady finansowe, inwestycyjne, tradingowe ani jakiekolwiek inne rekomendacje dostarczane lub zatwierdzone przez TradingView. Więcej informacji znajduje się w Warunkach użytkowania.
STWP | Mentor & Demand-Supply Specialist |
Empowering traders through structured learning |
simpletradewithpatience.com
chat.whatsapp.com/HaFVOsLKriN8wxmlBMbqgf
wa.me/message/6IOPHGOXMGZ4N1
Educational Only
Empowering traders through structured learning |
simpletradewithpatience.com
chat.whatsapp.com/HaFVOsLKriN8wxmlBMbqgf
wa.me/message/6IOPHGOXMGZ4N1
Educational Only
Wyłączenie odpowiedzialności
Informacje i publikacje nie stanowią i nie powinny być traktowane jako porady finansowe, inwestycyjne, tradingowe ani jakiekolwiek inne rekomendacje dostarczane lub zatwierdzone przez TradingView. Więcej informacji znajduje się w Warunkach użytkowania.