
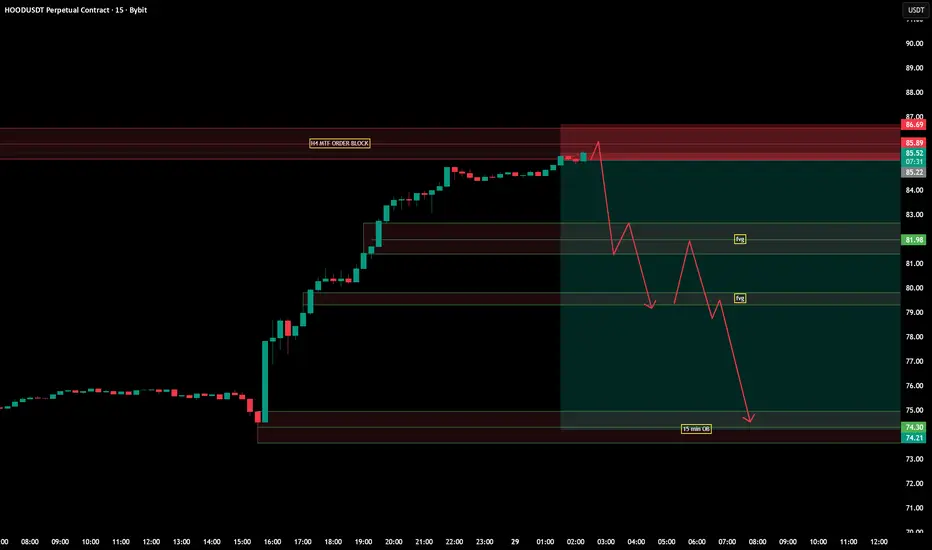
**HOODUSDT 15m — H4 Order Block Reaction Setup**
This idea is based on a 15-minute execution chart with a higher-timeframe H4 order block marked above current price.
Price has made a strong impulsive move to the upside and is now trading directly into a visible H4 order block / supply reaction area. On the lower timeframe, the move is extended and the oscillator is also showing an overbought condition, which makes this zone important to watch for a possible reaction.
The plan is not to enter blindly against the trend. The objective is to observe whether price can reject from the H4 order block and then start moving back toward the lower inefficiency zones.
Main context:
* Chart timeframe: 15 minutes
* Higher-timeframe zone: H4 order block
* Current area: price is testing the upper reaction zone
* Confirmation tool: oscillator is in overbought territory
* Lower targets / reaction zones: visible FVGs below price
* Invalidation: sustained acceptance above the H4 order block
The expected scenario would be:
1. Price taps or sweeps liquidity into the H4 order block.
2. A rejection appears on the 15-minute chart.
3. Short-term structure starts to weaken.
4. Price begins to rotate back toward the nearest FVG below.
5. If selling pressure continues, lower FVG zones may become the next areas of interest.
The first downside area I am watching is the closest FVG around the 82 region. Below that, additional inefficiency zones remain visible and may act as potential draw-on-liquidity areas if the reaction develops.
This is a top-down analysis:
* H4 provides the main order block context.
* 15m is used to watch execution and reaction.
* FVGs below price are used as potential retracement / mitigation zones.
* The oscillator is used only as secondary context, not as a standalone signal.
If price accepts above the H4 order block and continues holding above it, the bearish reaction idea is invalidated.
This publication is for educational and analytical purposes only. It is not financial advice, not a guaranteed setup, and not a recommendation to buy or sell. Always use your own risk management and confirmation process.
This idea is based on a 15-minute execution chart with a higher-timeframe H4 order block marked above current price.
Price has made a strong impulsive move to the upside and is now trading directly into a visible H4 order block / supply reaction area. On the lower timeframe, the move is extended and the oscillator is also showing an overbought condition, which makes this zone important to watch for a possible reaction.
The plan is not to enter blindly against the trend. The objective is to observe whether price can reject from the H4 order block and then start moving back toward the lower inefficiency zones.
Main context:
* Chart timeframe: 15 minutes
* Higher-timeframe zone: H4 order block
* Current area: price is testing the upper reaction zone
* Confirmation tool: oscillator is in overbought territory
* Lower targets / reaction zones: visible FVGs below price
* Invalidation: sustained acceptance above the H4 order block
The expected scenario would be:
1. Price taps or sweeps liquidity into the H4 order block.
2. A rejection appears on the 15-minute chart.
3. Short-term structure starts to weaken.
4. Price begins to rotate back toward the nearest FVG below.
5. If selling pressure continues, lower FVG zones may become the next areas of interest.
The first downside area I am watching is the closest FVG around the 82 region. Below that, additional inefficiency zones remain visible and may act as potential draw-on-liquidity areas if the reaction develops.
This is a top-down analysis:
* H4 provides the main order block context.
* 15m is used to watch execution and reaction.
* FVGs below price are used as potential retracement / mitigation zones.
* The oscillator is used only as secondary context, not as a standalone signal.
If price accepts above the H4 order block and continues holding above it, the bearish reaction idea is invalidated.
This publication is for educational and analytical purposes only. It is not financial advice, not a guaranteed setup, and not a recommendation to buy or sell. Always use your own risk management and confirmation process.

Light the candle that sleeps within you.
Wyłączenie odpowiedzialności
Informacje i publikacje nie stanowią i nie powinny być traktowane jako porady finansowe, inwestycyjne, tradingowe ani jakiekolwiek inne rekomendacje dostarczane lub zatwierdzone przez TradingView. Więcej informacji znajduje się w Warunkach użytkowania.
Light the candle that sleeps within you.
Wyłączenie odpowiedzialności
Informacje i publikacje nie stanowią i nie powinny być traktowane jako porady finansowe, inwestycyjne, tradingowe ani jakiekolwiek inne rekomendacje dostarczane lub zatwierdzone przez TradingView. Więcej informacji znajduje się w Warunkach użytkowania.