
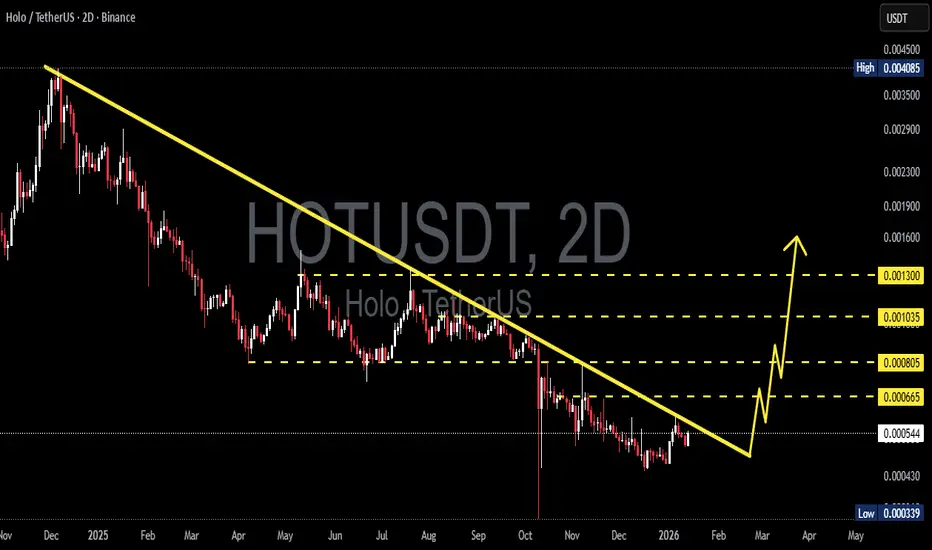
The HOT/USDT pair on the 2D timeframe remains in a long-term downtrend since the late-2024 peak. Price continues to form lower highs and lower lows, confirming strong seller dominance. Currently, price is consolidating after a sharp decline, positioned just below the major descending trendline.
---
Pattern Explanation
The chart clearly shows a Descending Trendline (Bearish Market Structure) that has been tested multiple times since early 2025 and has not been broken with valid confirmation.
Pattern characteristics:
A downward-sloping trendline originating from the major distribution high.
Each rebound fails to create a higher high.
Consolidation occurs below the trendline, indicating a bearish continuation structure.
Additional structure:
A tight range formed between 0.000665 – 0.000805
This reflects price compression, which often precedes an impulsive move (breakout or breakdown).
---
Key Levels
Resistance (Supply Zone):
0.000665
0.000805
0.001035
0.001300
Support (Demand Zone):
0.000544 (current area)
0.000430
0.000339 (major low)
---
Bullish Scenario
The bullish scenario is counter-trend and only valid with strong confirmation.
Bullish requirements:
1. Price breaks and closes above the descending trendline
2. Follow-through candles hold above 0.000665
3. Ideally supported by increasing volume
Bullish targets:
0.000805
0.001035
0.001300
Note:
As long as price remains below the trendline, any upside move should be considered a relief rally, not a full trend reversal.
---
Bearish Scenario
This remains the primary high-probability scenario based on current structure.
Bearish confirmation:
1. Rejection from the descending trendline
2. Breakdown below 0.000544 support
3. Strong candle close beneath the consolidation range
Downside targets:
0.000430
0.000339 (previous low / strong demand zone)
If 0.000339 fails, HOT may enter an extended accumulation or capitulation phase.
---
Conclusion
HOT/USDT is still trading within a bearish market structure with dominant selling pressure. The current consolidation sits directly below the descending trendline, making this zone extremely critical.
Traders are advised to:
Wait for confirmation before considering bullish entries
Respect bearish continuation as long as price stays below key resistance
Discipline and confirmation remain essential.
#HOTUSDT #HOLO #CryptoAnalysis #TechnicalAnalysis #BearishTrend #DescendingTrendline #AltcoinMarket #SupportResistance #PriceAction
---
Pattern Explanation
The chart clearly shows a Descending Trendline (Bearish Market Structure) that has been tested multiple times since early 2025 and has not been broken with valid confirmation.
Pattern characteristics:
A downward-sloping trendline originating from the major distribution high.
Each rebound fails to create a higher high.
Consolidation occurs below the trendline, indicating a bearish continuation structure.
Additional structure:
A tight range formed between 0.000665 – 0.000805
This reflects price compression, which often precedes an impulsive move (breakout or breakdown).
---
Key Levels
Resistance (Supply Zone):
0.000665
0.000805
0.001035
0.001300
Support (Demand Zone):
0.000544 (current area)
0.000430
0.000339 (major low)
---
Bullish Scenario
The bullish scenario is counter-trend and only valid with strong confirmation.
Bullish requirements:
1. Price breaks and closes above the descending trendline
2. Follow-through candles hold above 0.000665
3. Ideally supported by increasing volume
Bullish targets:
0.000805
0.001035
0.001300
Note:
As long as price remains below the trendline, any upside move should be considered a relief rally, not a full trend reversal.
---
Bearish Scenario
This remains the primary high-probability scenario based on current structure.
Bearish confirmation:
1. Rejection from the descending trendline
2. Breakdown below 0.000544 support
3. Strong candle close beneath the consolidation range
Downside targets:
0.000430
0.000339 (previous low / strong demand zone)
If 0.000339 fails, HOT may enter an extended accumulation or capitulation phase.
---
Conclusion
HOT/USDT is still trading within a bearish market structure with dominant selling pressure. The current consolidation sits directly below the descending trendline, making this zone extremely critical.
Traders are advised to:
Wait for confirmation before considering bullish entries
Respect bearish continuation as long as price stays below key resistance
Discipline and confirmation remain essential.
#HOTUSDT #HOLO #CryptoAnalysis #TechnicalAnalysis #BearishTrend #DescendingTrendline #AltcoinMarket #SupportResistance #PriceAction

✅ Get Free Signals! Join Our Telegram Channel Here: t.me/TheCryptoNuclear
✅ Twitter: twitter.com/crypto_nuclear
✅ Join Bybit : partner.bybit.com/b/nuclearvip
✅ Benefits : Lifetime Trading Fee Discount -50%
✅ Twitter: twitter.com/crypto_nuclear
✅ Join Bybit : partner.bybit.com/b/nuclearvip
✅ Benefits : Lifetime Trading Fee Discount -50%
Wyłączenie odpowiedzialności
Informacje i publikacje nie stanowią i nie powinny być traktowane jako porady finansowe, inwestycyjne, tradingowe ani jakiekolwiek inne rekomendacje dostarczane lub zatwierdzone przez TradingView. Więcej informacji znajduje się w Warunkach użytkowania.
✅ Get Free Signals! Join Our Telegram Channel Here: t.me/TheCryptoNuclear
✅ Twitter: twitter.com/crypto_nuclear
✅ Join Bybit : partner.bybit.com/b/nuclearvip
✅ Benefits : Lifetime Trading Fee Discount -50%
✅ Twitter: twitter.com/crypto_nuclear
✅ Join Bybit : partner.bybit.com/b/nuclearvip
✅ Benefits : Lifetime Trading Fee Discount -50%
Wyłączenie odpowiedzialności
Informacje i publikacje nie stanowią i nie powinny być traktowane jako porady finansowe, inwestycyjne, tradingowe ani jakiekolwiek inne rekomendacje dostarczane lub zatwierdzone przez TradingView. Więcej informacji znajduje się w Warunkach użytkowania.