
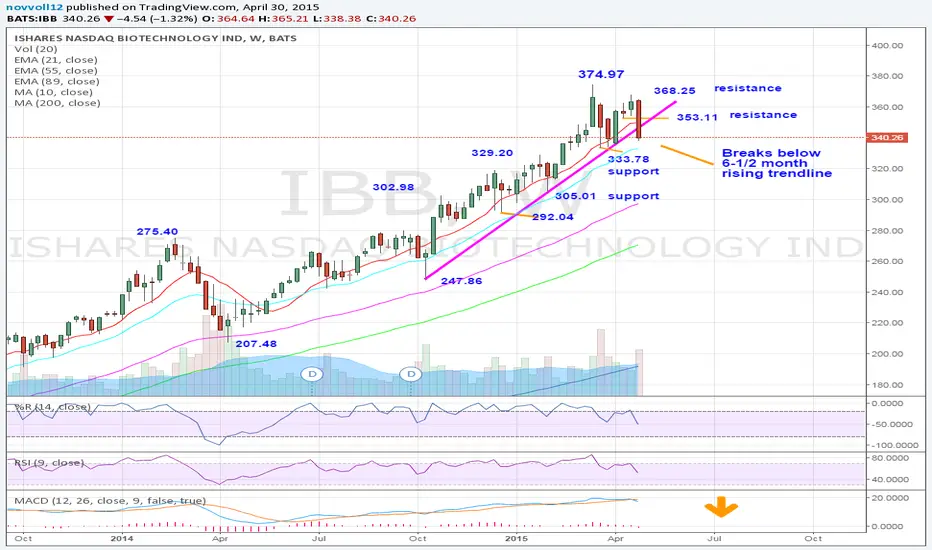
IBB corrected lower from the YTD high at 374.97 (March 20, 2015) to break blow 6-1/2 month rising trendline (as shown on the weekly chart), signaling prolonged consolidation near term. Bears look to test the range support at 333.78 (March 26, 2015 low). A breakdown is needed confirm a double top at 374.97/368.25 and weaken further towards the 305.01/302.98 long term support area. However, if the 333.78 area holds dips, that would reinforce the level as support. Back above 353.11 would suggest scope for further gains towards the 368.25 swing high (April 23, 2015).
Outlook:
Short term: bearish
Long term: bullish
Outlook:
Short term: bearish
Long term: bullish

Powiązane publikacje
Wyłączenie odpowiedzialności
Informacje i publikacje nie stanowią i nie powinny być traktowane jako porady finansowe, inwestycyjne, tradingowe ani jakiekolwiek inne rekomendacje dostarczane lub zatwierdzone przez TradingView. Więcej informacji znajduje się w Warunkach użytkowania.
Powiązane publikacje
Wyłączenie odpowiedzialności
Informacje i publikacje nie stanowią i nie powinny być traktowane jako porady finansowe, inwestycyjne, tradingowe ani jakiekolwiek inne rekomendacje dostarczane lub zatwierdzone przez TradingView. Więcej informacji znajduje się w Warunkach użytkowania.