
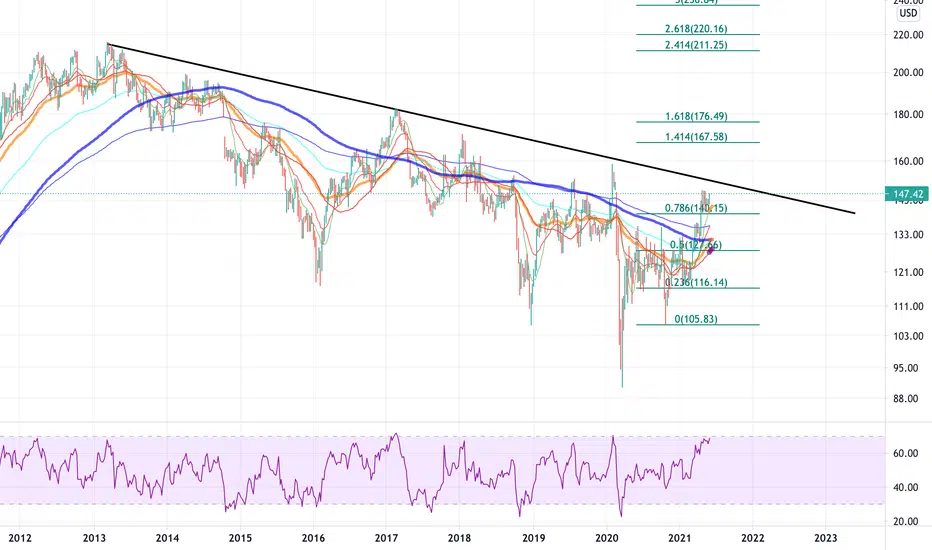
IBM weekly chart is currently in a downtrend but bullish cross of moving averages and potential break of the trend line could signify a change of trend and a profitable long trade.
I would wait for for the price to break the trend line (black line on the chart) to enter a long swing trade with a stop loss not too far to protect from a failed break.
Levels and targets on the chart.
Trade safe.
I would wait for for the price to break the trend line (black line on the chart) to enter a long swing trade with a stop loss not too far to protect from a failed break.
Levels and targets on the chart.
Trade safe.

Wyłączenie odpowiedzialności
Informacje i publikacje nie stanowią i nie powinny być traktowane jako porady finansowe, inwestycyjne, tradingowe ani jakiekolwiek inne rekomendacje dostarczane lub zatwierdzone przez TradingView. Więcej informacji znajduje się w Warunkach użytkowania.
Wyłączenie odpowiedzialności
Informacje i publikacje nie stanowią i nie powinny być traktowane jako porady finansowe, inwestycyjne, tradingowe ani jakiekolwiek inne rekomendacje dostarczane lub zatwierdzone przez TradingView. Więcej informacji znajduje się w Warunkach użytkowania.