
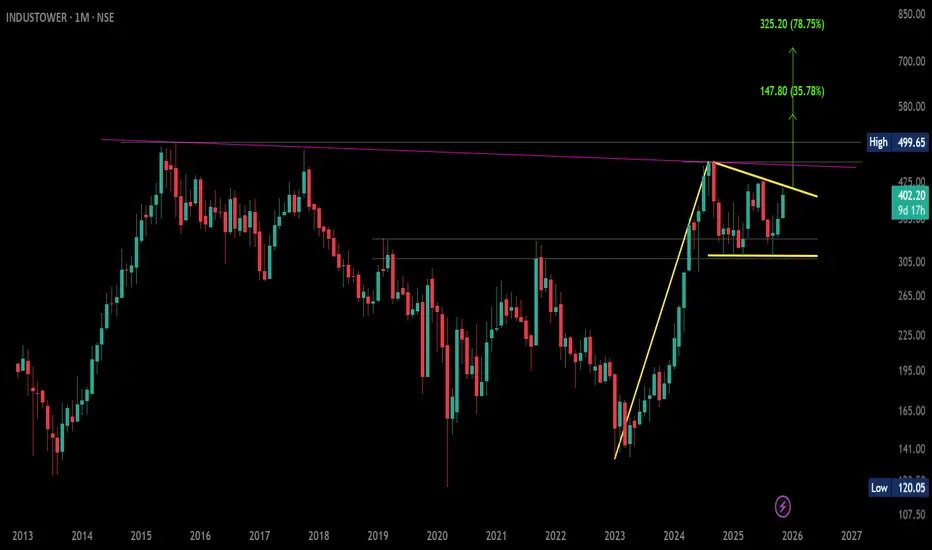
#IndusTower | CMP: 402.20
A strong vertical rally built the pole, and price is now compressing inside a tight bullish pennant right below a multi-year resistance zone. Consolidation is nearly complete — big move loading.
🛡 Supports: 339–335 / 313–309 (Major Zone)
🚧 Resistances: 430 / 460 / 500 (ATH)
Dips toward 335 can be considered.
🎯 Pennant Breakout Targets (Pole Projection):
• 560
• 730+ (~ 78% from CMP)
A breakout above 500 could trigger the next explosive leg up.
🚀 High-probability bullish continuation setup. 🔥
#IndusTower #BullishPennant #PriceAction #ChartPattern #SwingTrading #LongTerm
📌 #Disclaimer: This analysis is shared for educational purposes only. It is not a buy/sell recommendation. Please do your own research before making any trading decisions.
A strong vertical rally built the pole, and price is now compressing inside a tight bullish pennant right below a multi-year resistance zone. Consolidation is nearly complete — big move loading.
🛡 Supports: 339–335 / 313–309 (Major Zone)
🚧 Resistances: 430 / 460 / 500 (ATH)
Dips toward 335 can be considered.
🎯 Pennant Breakout Targets (Pole Projection):
• 560
• 730+ (~ 78% from CMP)
A breakout above 500 could trigger the next explosive leg up.
🚀 High-probability bullish continuation setup. 🔥
#IndusTower #BullishPennant #PriceAction #ChartPattern #SwingTrading #LongTerm
📌 #Disclaimer: This analysis is shared for educational purposes only. It is not a buy/sell recommendation. Please do your own research before making any trading decisions.

Wyłączenie odpowiedzialności
Informacje i publikacje nie stanowią i nie powinny być traktowane jako porady finansowe, inwestycyjne, tradingowe ani jakiekolwiek inne rekomendacje dostarczane lub zatwierdzone przez TradingView. Więcej informacji znajduje się w Warunkach użytkowania.
Wyłączenie odpowiedzialności
Informacje i publikacje nie stanowią i nie powinny być traktowane jako porady finansowe, inwestycyjne, tradingowe ani jakiekolwiek inne rekomendacje dostarczane lub zatwierdzone przez TradingView. Więcej informacji znajduje się w Warunkach użytkowania.