
📊 Current Context
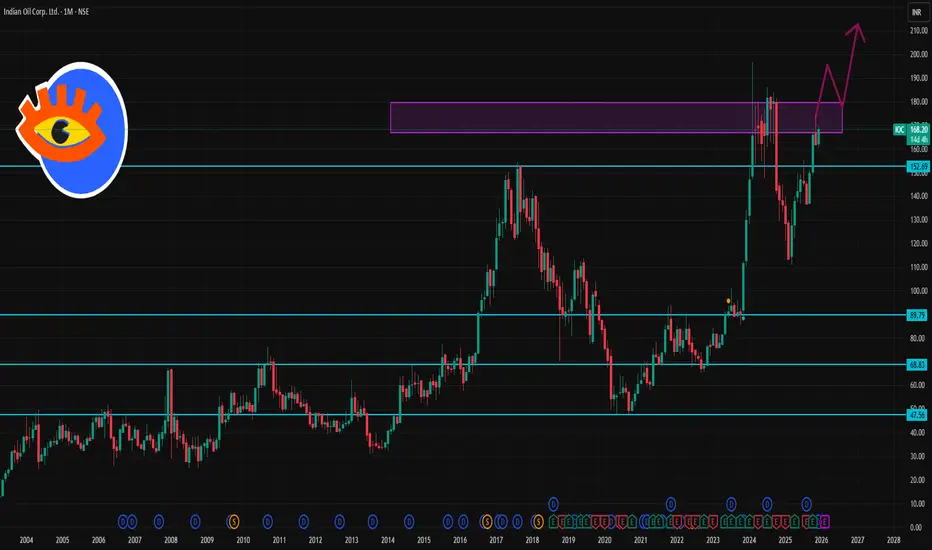
IOC is trading around the ₹166–₹168 range as of mid‑December 2025.
Over the last month, the stock has seen a slight decline (~‑2.7% to ‑3.6% depending on source).
🟢 Key 1‑Month Support Levels
These are levels where the price may find buying interest if the stock pulls back:
✅ Primary Support: ~₹164–₹162
➡️ Near recent lows and pivot zone where short‑term buyers could step in.
✅ Lower Support: ~₹160–₹158
➡️ Broader support band from slight chart congestion.
⚠️ Deep Support: ~₹138–₹135
➡️ A deeper correction zone identified by longer‑term indicators — likely only relevant if broader markets turn very weak.
🔴 Key 1‑Month Resistance Levels
These are price points that may cap upside near‑term:
🚧 Immediate Resistance: ~₹170–₹171
➡️ Short‑term hurdle around recent highs.
🚧 Next Resistance: ~₹172–₹173
➡️ Slightly stronger resistance if stock breaks above ₹171.
🚧 Higher Resistance: ~₹176–₹177+
➡️ Breakout zone toward the upper end of the near‑term range.
IOC is trading around the ₹166–₹168 range as of mid‑December 2025.
Over the last month, the stock has seen a slight decline (~‑2.7% to ‑3.6% depending on source).
🟢 Key 1‑Month Support Levels
These are levels where the price may find buying interest if the stock pulls back:
✅ Primary Support: ~₹164–₹162
➡️ Near recent lows and pivot zone where short‑term buyers could step in.
✅ Lower Support: ~₹160–₹158
➡️ Broader support band from slight chart congestion.
⚠️ Deep Support: ~₹138–₹135
➡️ A deeper correction zone identified by longer‑term indicators — likely only relevant if broader markets turn very weak.
🔴 Key 1‑Month Resistance Levels
These are price points that may cap upside near‑term:
🚧 Immediate Resistance: ~₹170–₹171
➡️ Short‑term hurdle around recent highs.
🚧 Next Resistance: ~₹172–₹173
➡️ Slightly stronger resistance if stock breaks above ₹171.
🚧 Higher Resistance: ~₹176–₹177+
➡️ Breakout zone toward the upper end of the near‑term range.

Contact Knowledgehub for a detailed consultation: Dm on WhatsApp: [wa.link/a2o0kz]-
Phone No: [+91 93102 26243]-
Email: [tradingviewknowledgehub@gmail.com]---
-- Let’s achieve success together!
Phone No: [+91 93102 26243]-
Email: [tradingviewknowledgehub@gmail.com]---
-- Let’s achieve success together!
Powiązane publikacje
Wyłączenie odpowiedzialności
Informacje i publikacje nie stanowią i nie powinny być traktowane jako porady finansowe, inwestycyjne, tradingowe ani jakiekolwiek inne rekomendacje dostarczane lub zatwierdzone przez TradingView. Więcej informacji znajduje się w Warunkach użytkowania.
Contact Knowledgehub for a detailed consultation: Dm on WhatsApp: [wa.link/a2o0kz]-
Phone No: [+91 93102 26243]-
Email: [tradingviewknowledgehub@gmail.com]---
-- Let’s achieve success together!
Phone No: [+91 93102 26243]-
Email: [tradingviewknowledgehub@gmail.com]---
-- Let’s achieve success together!
Powiązane publikacje
Wyłączenie odpowiedzialności
Informacje i publikacje nie stanowią i nie powinny być traktowane jako porady finansowe, inwestycyjne, tradingowe ani jakiekolwiek inne rekomendacje dostarczane lub zatwierdzone przez TradingView. Więcej informacji znajduje się w Warunkach użytkowania.