
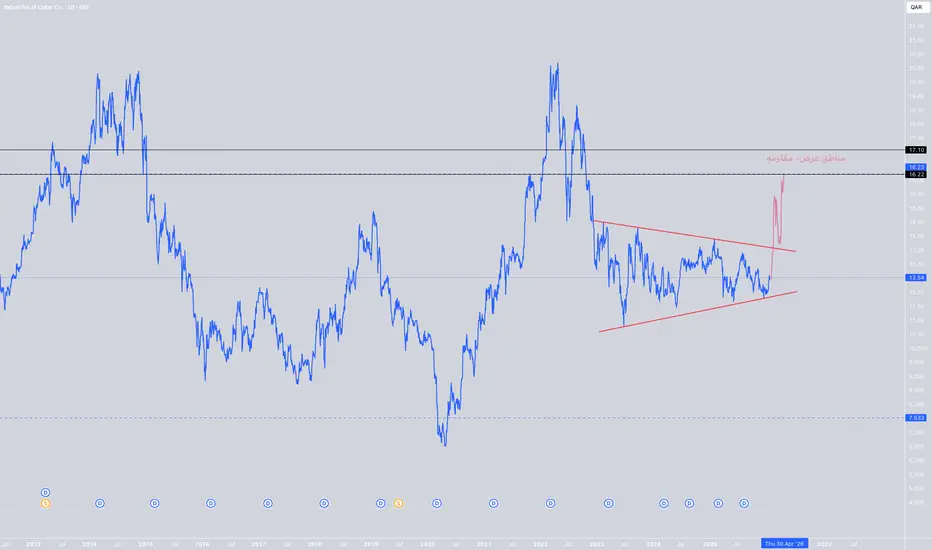
Stock: Industries Qatar
🔹 Big Picture
The stock has been in a broad sideways range since the 2022 peak.
Price is currently moving inside a symmetrical triangle (higher lows + lower highs).
This structure usually represents accumulation before a strong move.
🔹 Key Price Levels
🟥 Resistance / Supply Zones
16.20 – 16.30
Major resistance + upper boundary of the supply zone.
17.10
Very strong historical resistance (previous major peak).
🟩 Support Zones
12.20 – 12.40
Current support + lower boundary of the triangle.
11.00 – 10.80
Medium-term support.
7.50 – 7.60
Long-term historical support (only in a deep bearish scenario).
🔹 Expected Scenarios
✅ Bullish Scenario (Technically Favored)
Clear breakout and weekly close above 16.30
Upside targets:
🎯 17.10
🎯 18.80
🎯 20.00+ (medium-term)
📌 Fits well with QGMD’s nature as a dividend + steady growth stock.
⚠️ Bearish Scenario
Weekly close below 12.20
Downside targets:
11.00
Then 10.00 – 9.50
This scenario remains less likely as long as price holds inside the triangle.
🔹 Important Note
Current price action shows volatility compression.
The longer the price stays inside the triangle → the stronger the eventual breakout.
Not ideal for short-term scalping, but very suitable for strategic positioning.
🎯 Summary
Technically: Accumulation phase
Smart approach:
Trader → wait for 16.30 breakout
Investor → accumulate near support with patience
🔹 Big Picture
The stock has been in a broad sideways range since the 2022 peak.
Price is currently moving inside a symmetrical triangle (higher lows + lower highs).
This structure usually represents accumulation before a strong move.
🔹 Key Price Levels
🟥 Resistance / Supply Zones
16.20 – 16.30
Major resistance + upper boundary of the supply zone.
17.10
Very strong historical resistance (previous major peak).
🟩 Support Zones
12.20 – 12.40
Current support + lower boundary of the triangle.
11.00 – 10.80
Medium-term support.
7.50 – 7.60
Long-term historical support (only in a deep bearish scenario).
🔹 Expected Scenarios
✅ Bullish Scenario (Technically Favored)
Clear breakout and weekly close above 16.30
Upside targets:
🎯 17.10
🎯 18.80
🎯 20.00+ (medium-term)
📌 Fits well with QGMD’s nature as a dividend + steady growth stock.
⚠️ Bearish Scenario
Weekly close below 12.20
Downside targets:
11.00
Then 10.00 – 9.50
This scenario remains less likely as long as price holds inside the triangle.
🔹 Important Note
Current price action shows volatility compression.
The longer the price stays inside the triangle → the stronger the eventual breakout.
Not ideal for short-term scalping, but very suitable for strategic positioning.
🎯 Summary
Technically: Accumulation phase
Smart approach:
Trader → wait for 16.30 breakout
Investor → accumulate near support with patience

Wyłączenie odpowiedzialności
Informacje i publikacje nie stanowią i nie powinny być traktowane jako porady finansowe, inwestycyjne, tradingowe ani jakiekolwiek inne rekomendacje dostarczane lub zatwierdzone przez TradingView. Więcej informacji znajduje się w Warunkach użytkowania.
Wyłączenie odpowiedzialności
Informacje i publikacje nie stanowią i nie powinny być traktowane jako porady finansowe, inwestycyjne, tradingowe ani jakiekolwiek inne rekomendacje dostarczane lub zatwierdzone przez TradingView. Więcej informacji znajduje się w Warunkach użytkowania.