Long
Trending Kellog
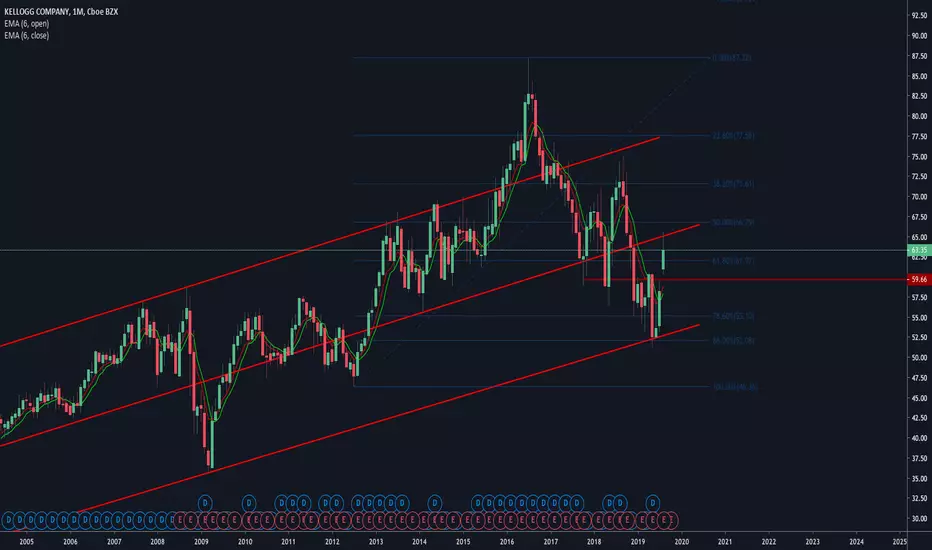
Chart Analysis
It's a bit late, but we see on weekly and monthly chart that $NYSE:K made a nice turn on long term trendline.
Last week the chart formed a nice low around the Fibonacci 78.6.
Of course, we missed the low, but maybe we get a second chance around 60$ to enter.
Dividend
3.6% dividend
Payout ratio 58%
14 years Dividend Growth
It's a bit late, but we see on weekly and monthly chart that $NYSE:K made a nice turn on long term trendline.
Last week the chart formed a nice low around the Fibonacci 78.6.
Of course, we missed the low, but maybe we get a second chance around 60$ to enter.
Dividend
3.6% dividend
Payout ratio 58%
14 years Dividend Growth

Wyłączenie odpowiedzialności
Informacje i publikacje nie stanowią i nie powinny być traktowane jako porady finansowe, inwestycyjne, tradingowe ani jakiekolwiek inne rekomendacje dostarczane lub zatwierdzone przez TradingView. Więcej informacji znajduje się w Warunkach użytkowania.
Wyłączenie odpowiedzialności
Informacje i publikacje nie stanowią i nie powinny być traktowane jako porady finansowe, inwestycyjne, tradingowe ani jakiekolwiek inne rekomendacje dostarczane lub zatwierdzone przez TradingView. Więcej informacji znajduje się w Warunkach użytkowania.