
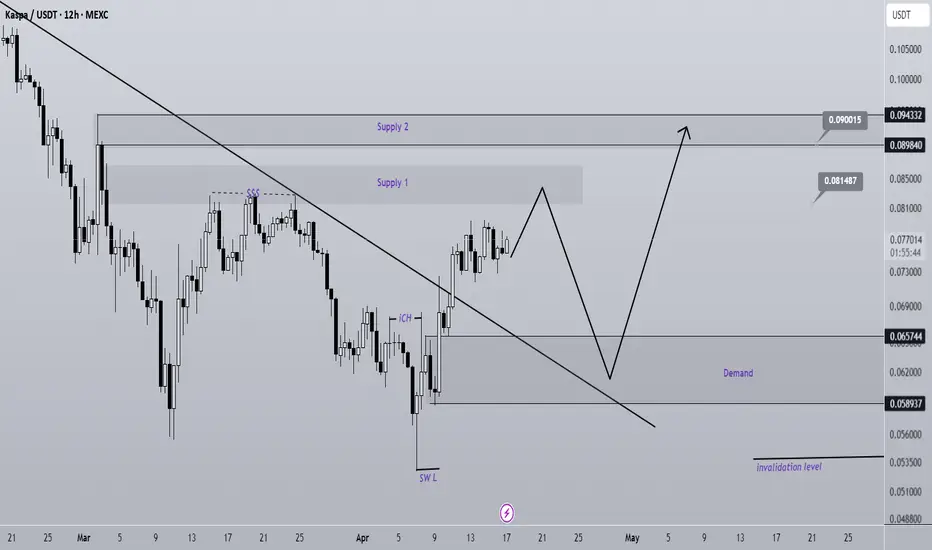
A significant trendline has been broken on the chart, and a bullish iCH formation has also formed. Additionally, a liquidity pool is visible above the chart, which is expected to be swept soon.
The demand zone is our entry area. If the price reaches this zone before touching Supply 2, we can consider entering a position.
A daily candle close below the invalidation level will invalidate this analysis.
Do not enter the position without capital management and stop setting
Comment if you have any questions
thank you
The demand zone is our entry area. If the price reaches this zone before touching Supply 2, we can consider entering a position.
A daily candle close below the invalidation level will invalidate this analysis.
Do not enter the position without capital management and stop setting
Comment if you have any questions
thank you

🔥 High profit futures and spot signals are published only on our Telegram
t.me/iMoney_T
🔥 We provide signals and analysis on Telegram hourly and daily
t.me/iMoney_T
🔥 Exclusive signals are only published on our Telegram channels.
t.me/iMoney_T
🔥 We provide signals and analysis on Telegram hourly and daily
t.me/iMoney_T
🔥 Exclusive signals are only published on our Telegram channels.
Wyłączenie odpowiedzialności
Informacje i publikacje nie stanowią i nie powinny być traktowane jako porady finansowe, inwestycyjne, tradingowe ani jakiekolwiek inne rekomendacje dostarczane lub zatwierdzone przez TradingView. Więcej informacji znajduje się w Warunkach użytkowania.
🔥 High profit futures and spot signals are published only on our Telegram
t.me/iMoney_T
🔥 We provide signals and analysis on Telegram hourly and daily
t.me/iMoney_T
🔥 Exclusive signals are only published on our Telegram channels.
t.me/iMoney_T
🔥 We provide signals and analysis on Telegram hourly and daily
t.me/iMoney_T
🔥 Exclusive signals are only published on our Telegram channels.
Wyłączenie odpowiedzialności
Informacje i publikacje nie stanowią i nie powinny być traktowane jako porady finansowe, inwestycyjne, tradingowe ani jakiekolwiek inne rekomendacje dostarczane lub zatwierdzone przez TradingView. Więcej informacji znajduje się w Warunkach użytkowania.