Long
Komodo found the bottom?!?
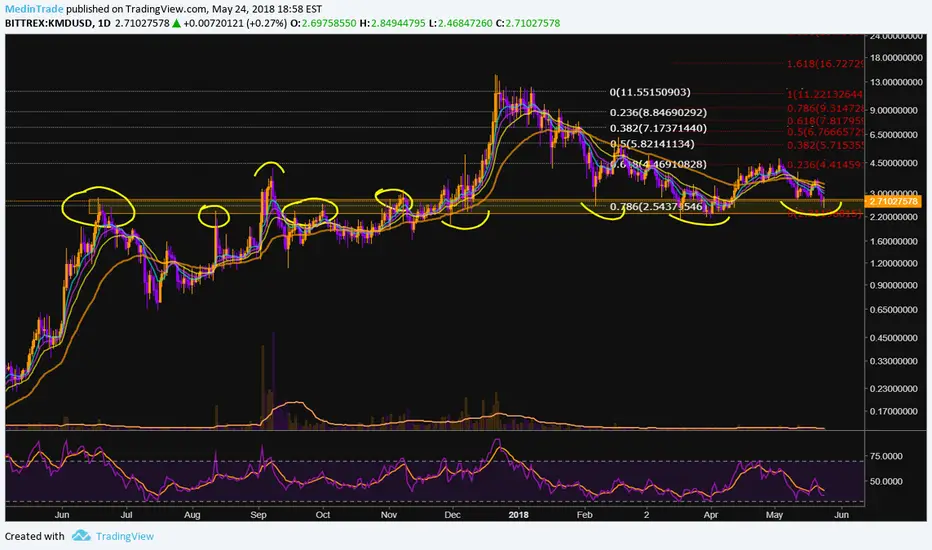
Chart should speak by itself. But in case it doesn't, you can see the yellow circles mark what was once the resistance, which is now a strong support. The more an area of resistance/support is tested the stronger it is. It happen to be the Fibo 0.786, what a coincidence!!! For a long term investment, we can be pretty sure this a really good accumulation zone!!! That's for the TA, now here you that is for those that like FA : glx.co/blog/komodo-platform-ranked-2nd-for-innovation-behind-bitcoin/
Not financial advise bla bla ...
TRADE SAFE!!!
Not financial advise bla bla ...
TRADE SAFE!!!

Free Discord: discord.gg/vfXTGJMZMq
Wyłączenie odpowiedzialności
Informacje i publikacje nie stanowią i nie powinny być traktowane jako porady finansowe, inwestycyjne, tradingowe ani jakiekolwiek inne rekomendacje dostarczane lub zatwierdzone przez TradingView. Więcej informacji znajduje się w Warunkach użytkowania.
Free Discord: discord.gg/vfXTGJMZMq
Wyłączenie odpowiedzialności
Informacje i publikacje nie stanowią i nie powinny być traktowane jako porady finansowe, inwestycyjne, tradingowe ani jakiekolwiek inne rekomendacje dostarczane lub zatwierdzone przez TradingView. Więcej informacji znajduje się w Warunkach użytkowania.