Long
KNCUSD - Weekly analysis
ANALYSIS 🔎
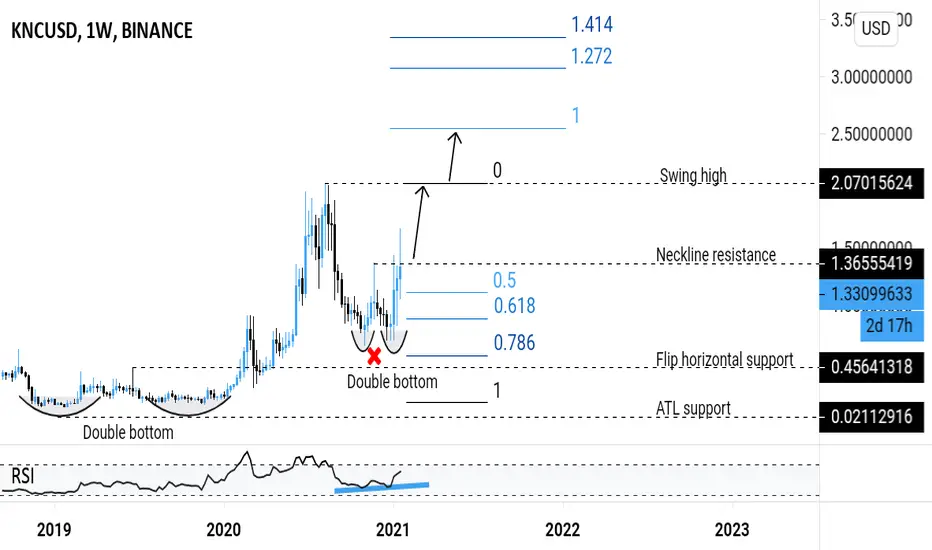
- KNCUSD retested the flip horizontal support and 0.618 fibonacci retracement level.
- Price action printed the double bottom trend reversal pattern.
- Price brokeout above the double bottom neckline resistance.
- This is a bullish signal.
- RSI printed a bullish divergence signal.
TARGETS 🎯
- Swing high
- Fibonacci extension levels
- KNCUSD retested the flip horizontal support and 0.618 fibonacci retracement level.
- Price action printed the double bottom trend reversal pattern.
- Price brokeout above the double bottom neckline resistance.
- This is a bullish signal.
- RSI printed a bullish divergence signal.
TARGETS 🎯
- Swing high
- Fibonacci extension levels

Wyłączenie odpowiedzialności
Informacje i publikacje nie stanowią i nie powinny być traktowane jako porady finansowe, inwestycyjne, tradingowe ani jakiekolwiek inne rekomendacje dostarczane lub zatwierdzone przez TradingView. Więcej informacji znajduje się w Warunkach użytkowania.
Wyłączenie odpowiedzialności
Informacje i publikacje nie stanowią i nie powinny być traktowane jako porady finansowe, inwestycyjne, tradingowe ani jakiekolwiek inne rekomendacje dostarczane lub zatwierdzone przez TradingView. Więcej informacji znajduje się w Warunkach użytkowania.