Long
KORS Breaking Out
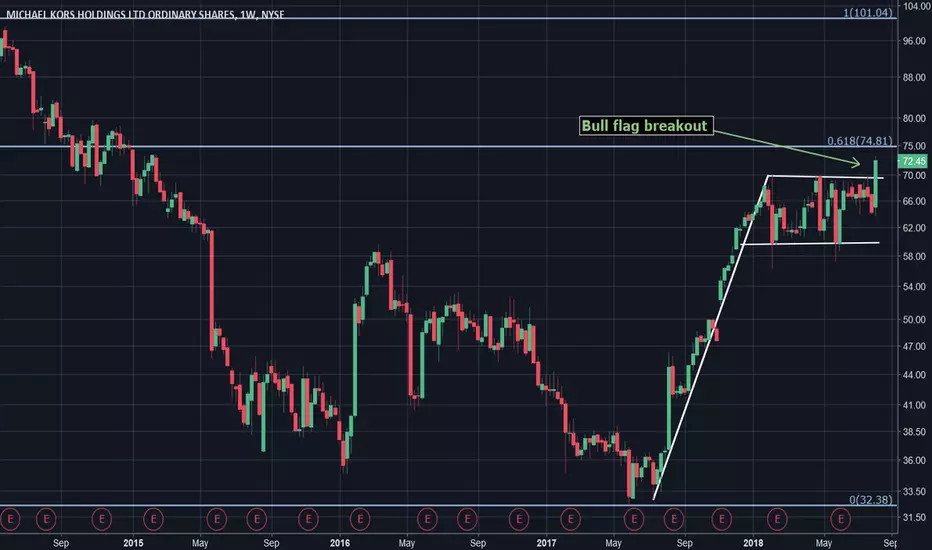
Shares of KORS appear to be breaking out to the upside from a bull flag formation on the weekly chart. Previous resistance at $70 should act as support to confirm.
Longer-term resistance overhead at $75, the 61.8% retracement from the all-time highs north of $100 to the subsequent lows at $33.
The target from the flag is around $82-85, which would coincide nicely with the 78.6% retracement at $86 of the aforementioned high to low.
Look for the breakout to be confirmed with a weekly close above $70 and a successful retest of that level before shares ramp higher.
Longer-term resistance overhead at $75, the 61.8% retracement from the all-time highs north of $100 to the subsequent lows at $33.
The target from the flag is around $82-85, which would coincide nicely with the 78.6% retracement at $86 of the aforementioned high to low.
Look for the breakout to be confirmed with a weekly close above $70 and a successful retest of that level before shares ramp higher.

Wyłączenie odpowiedzialności
Informacje i publikacje nie stanowią i nie powinny być traktowane jako porady finansowe, inwestycyjne, tradingowe ani jakiekolwiek inne rekomendacje dostarczane lub zatwierdzone przez TradingView. Więcej informacji znajduje się w Warunkach użytkowania.
Wyłączenie odpowiedzialności
Informacje i publikacje nie stanowią i nie powinny być traktowane jako porady finansowe, inwestycyjne, tradingowe ani jakiekolwiek inne rekomendacje dostarczane lub zatwierdzone przez TradingView. Więcej informacji znajduje się w Warunkach użytkowania.