
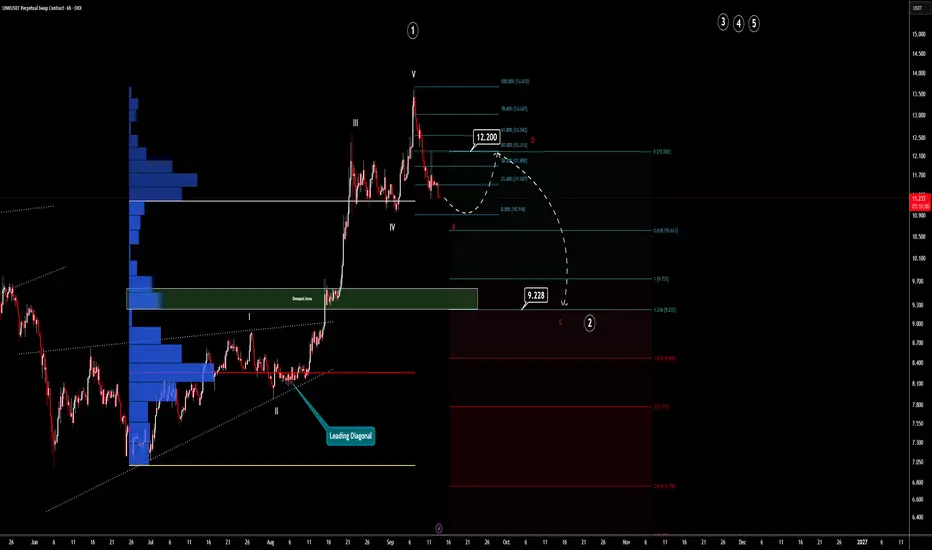
Chainlink shows a clear sign that an inner impulsive move is coming to an end.
This chart shows a clear textbook illustration of Elliott Wave analysis.
After forming the diagonal, an impulsive move has ended. Now is the time for an A-B-C correction, and that small correction is going to create a wave 2 move on the daily timeframe.
If we consider the Fed + BOJ rate decisions in the coming days, this chart makes even more sense.
No need for complicated explanations. First down, then up. Simple as that.
This chart shows a clear textbook illustration of Elliott Wave analysis.
After forming the diagonal, an impulsive move has ended. Now is the time for an A-B-C correction, and that small correction is going to create a wave 2 move on the daily timeframe.
If we consider the Fed + BOJ rate decisions in the coming days, this chart makes even more sense.
No need for complicated explanations. First down, then up. Simple as that.
Transakcja zamknięta: osiągnięto wyznaczony cel
Link has reached its wave B target, do not try to short anything, market is bullish. Analysis might be invalidated easily.
Wyłączenie odpowiedzialności
Informacje i publikacje nie stanowią i nie powinny być traktowane jako porady finansowe, inwestycyjne, tradingowe ani jakiekolwiek inne rekomendacje dostarczane lub zatwierdzone przez TradingView. Więcej informacji znajduje się w Warunkach użytkowania.
Wyłączenie odpowiedzialności
Informacje i publikacje nie stanowią i nie powinny być traktowane jako porady finansowe, inwestycyjne, tradingowe ani jakiekolwiek inne rekomendacje dostarczane lub zatwierdzone przez TradingView. Więcej informacji znajduje się w Warunkach użytkowania.