
Eli Lilly (LLY) – Macro Elliott Wave, Fibonacci & Historic $1 Trillion Milestone
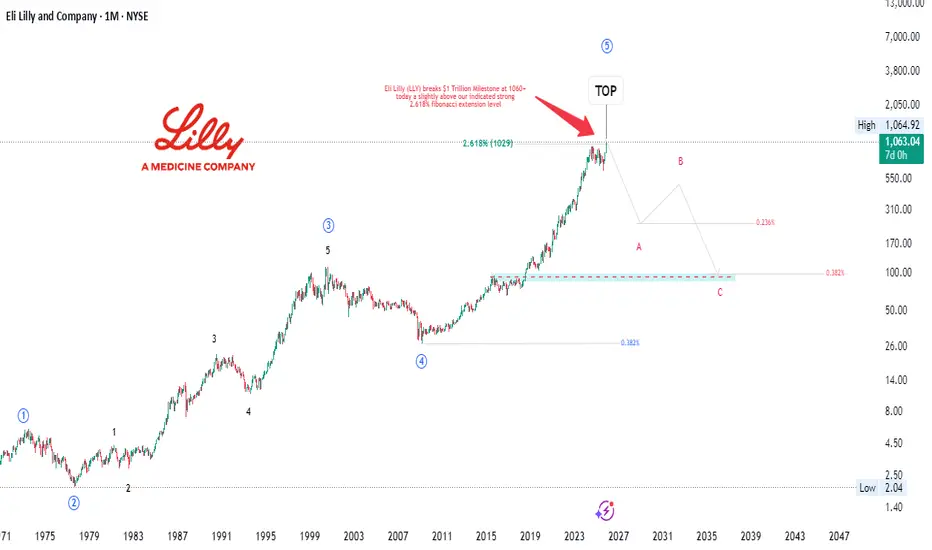
LLY has now reached a critical long-term inflection point, advancing directly into the 2.618 Fibonacci extension, completing the projection of a full five-wave Elliott Wave cycle. This precise alignment establishes the 1060 region as a high-confidence macro top zone.
At today’s high of 1060, LLY also achieved a historic milestone - crossing the $1 Trillion market-cap threshold, becoming the first medical company in history to reach this valuation. This achievement underscores the extraordinary scale of the preceding multi-year impulse and reinforces the significance of the current structural level.
With price holding at these unprecedented highs, the market is operating deep within a premium zone, where long-cycle reversals typically begin. While the bullish structure remains intact for now, the confluence of Fibonacci exhaustion, wave completion, and valuation extremity creates a strong, affirmative expectation that LLY is entering its macro topping phase.
The broader corrective roadmap follows a classical A–B–C structure, with downside levels anchored to key long-term Fibonacci retracements:
• The 0.236 retracement at ~245 forms the primary target for the anticipated Wave A leg, aligning with prior institutional accumulation and structural demand.
• The 0.382 retracement at ~98 represents the major macro demand zone and the high-probability destination for full cycle re-pricing via Wave C.
Taken together - the completed Elliott Wave structure, extreme Fibonacci extension, and the unprecedented $1T milestone - LLY stands at one of the most significant macro levels in its history. The next major move is expected to guide the market from its expansionary phase into a multi-year structural correction, with clearly defined downside objectives.
What do YOU think happens next?
Breakout or fake-out? Drop your prediction below!
👇 We are replying to every comment - let’s talk charts.
Smash the 👍 if this helped, hit 🔔 to catch the next setup,
and FOLLOW for more high-probability wave + SMC plays.
⚠️ Disclaimer
This content is for educational and informational purposes only and does not constitute financial, investment, or trading advice. All analyses reflect personal opinions based on publicly available data and chart structures. Markets involve risk, and you should always perform your own research or consult a licensed financial professional before making any trading decisions. Past performance does not guarantee future results.
LLY has now reached a critical long-term inflection point, advancing directly into the 2.618 Fibonacci extension, completing the projection of a full five-wave Elliott Wave cycle. This precise alignment establishes the 1060 region as a high-confidence macro top zone.
At today’s high of 1060, LLY also achieved a historic milestone - crossing the $1 Trillion market-cap threshold, becoming the first medical company in history to reach this valuation. This achievement underscores the extraordinary scale of the preceding multi-year impulse and reinforces the significance of the current structural level.
With price holding at these unprecedented highs, the market is operating deep within a premium zone, where long-cycle reversals typically begin. While the bullish structure remains intact for now, the confluence of Fibonacci exhaustion, wave completion, and valuation extremity creates a strong, affirmative expectation that LLY is entering its macro topping phase.
The broader corrective roadmap follows a classical A–B–C structure, with downside levels anchored to key long-term Fibonacci retracements:
• The 0.236 retracement at ~245 forms the primary target for the anticipated Wave A leg, aligning with prior institutional accumulation and structural demand.
• The 0.382 retracement at ~98 represents the major macro demand zone and the high-probability destination for full cycle re-pricing via Wave C.
Taken together - the completed Elliott Wave structure, extreme Fibonacci extension, and the unprecedented $1T milestone - LLY stands at one of the most significant macro levels in its history. The next major move is expected to guide the market from its expansionary phase into a multi-year structural correction, with clearly defined downside objectives.
What do YOU think happens next?
Breakout or fake-out? Drop your prediction below!
👇 We are replying to every comment - let’s talk charts.
Smash the 👍 if this helped, hit 🔔 to catch the next setup,
and FOLLOW for more high-probability wave + SMC plays.
⚠️ Disclaimer
This content is for educational and informational purposes only and does not constitute financial, investment, or trading advice. All analyses reflect personal opinions based on publicly available data and chart structures. Markets involve risk, and you should always perform your own research or consult a licensed financial professional before making any trading decisions. Past performance does not guarantee future results.
Zlecenie aktywne
Stock is 23% down so far which means lily's market cap reduced $250 Billions from its top.

Powiązane publikacje
Wyłączenie odpowiedzialności
Informacje i publikacje nie stanowią i nie powinny być traktowane jako porady finansowe, inwestycyjne, tradingowe ani jakiekolwiek inne rekomendacje dostarczane lub zatwierdzone przez TradingView. Więcej informacji znajduje się w Warunkach użytkowania.
Powiązane publikacje
Wyłączenie odpowiedzialności
Informacje i publikacje nie stanowią i nie powinny być traktowane jako porady finansowe, inwestycyjne, tradingowe ani jakiekolwiek inne rekomendacje dostarczane lub zatwierdzone przez TradingView. Więcej informacji znajduje się w Warunkach użytkowania.