
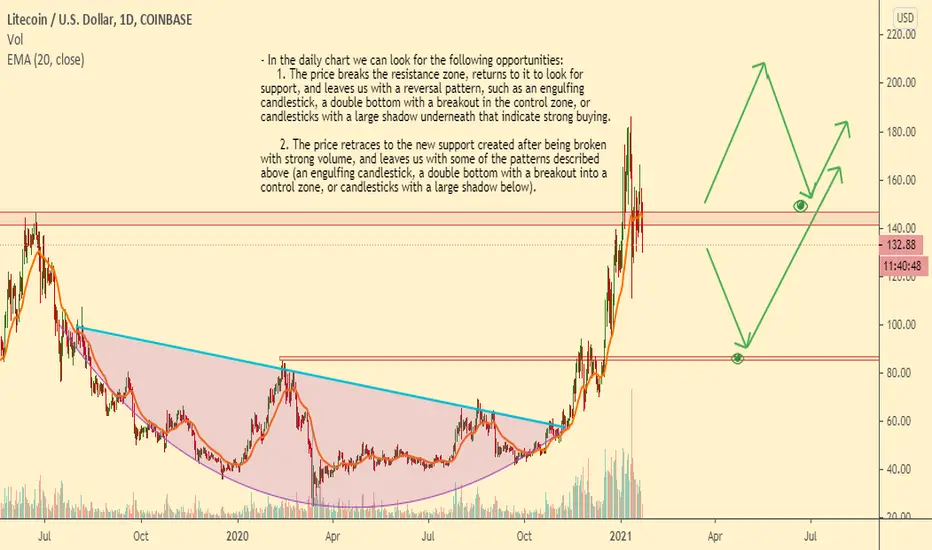
- In the daily chart we can look for the following opportunities:
1. The price breaks the resistance zone, returns to it to look for support, and leaves us with a reversal pattern, such as an engulfing candlestick, a double bottom with a breakout in the control zone, or candlesticks with a large shadow underneath that indicate strong buying.
2. The price retraces to the new support created after being broken with strong volume, and leaves us with some of the patterns described above (an engulfing candlestick, a double bottom with a breakout into a control zone, or candlesticks with a large shadow below).
1. The price breaks the resistance zone, returns to it to look for support, and leaves us with a reversal pattern, such as an engulfing candlestick, a double bottom with a breakout in the control zone, or candlesticks with a large shadow underneath that indicate strong buying.
2. The price retraces to the new support created after being broken with strong volume, and leaves us with some of the patterns described above (an engulfing candlestick, a double bottom with a breakout into a control zone, or candlesticks with a large shadow below).

Wyłączenie odpowiedzialności
Informacje i publikacje nie stanowią i nie powinny być traktowane jako porady finansowe, inwestycyjne, tradingowe ani jakiekolwiek inne rekomendacje dostarczane lub zatwierdzone przez TradingView. Więcej informacji znajduje się w Warunkach użytkowania.
Wyłączenie odpowiedzialności
Informacje i publikacje nie stanowią i nie powinny być traktowane jako porady finansowe, inwestycyjne, tradingowe ani jakiekolwiek inne rekomendacje dostarczane lub zatwierdzone przez TradingView. Więcej informacji znajduje się w Warunkach użytkowania.