
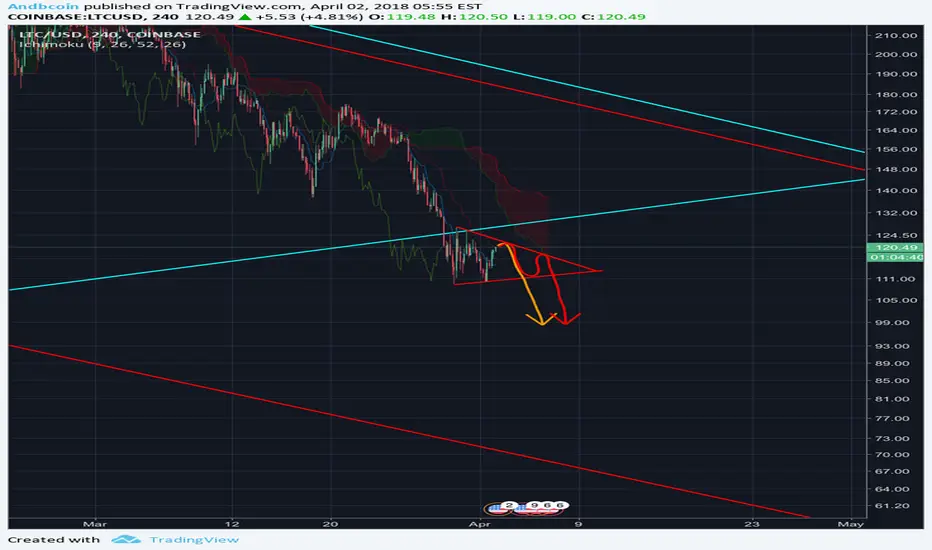
It’s not the bottom. Just another bearish triangle.
Ichimoku showing bearish trend.
Broken support that now acts as a resistance.
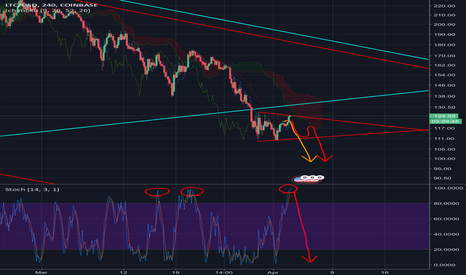
RSI oversold, so it has to “reset” by pumping a bit. As I can see, when it’s oversold, it pumps a bit, dumps deeper, and so on to keep resetting the RSI.
Ichimoku showing bearish trend.
Broken support that now acts as a resistance.
RSI oversold, so it has to “reset” by pumping a bit. As I can see, when it’s oversold, it pumps a bit, dumps deeper, and so on to keep resetting the RSI.
Uwaga
Hi, there! I've seen the triangle has to be adjusted according to the new price and maybe it isn't a triangle but a flag. The previous price made me think it was a triangle. It will not go further than 126 - 127 dollars. Sorry for this mistake.
Uwaga
New update according to the new price level.Trade carefully:).
Uwaga
I want to update the info because it resulted in a bearish flag more than in a bearish triangle. I don’t see LTC going any further since Stochastics is at the maximum level and it has to go down again.Uwaga
LTC is unable to get through the blue resistance. But if it does, it means it’s a clear trap and some people will lose their money. I wouldn’t trade with this scenario, but as I always say, trade at your own risk and do what you consider to be right. :)

Wyłączenie odpowiedzialności
Informacje i publikacje nie stanowią i nie powinny być traktowane jako porady finansowe, inwestycyjne, tradingowe ani jakiekolwiek inne rekomendacje dostarczane lub zatwierdzone przez TradingView. Więcej informacji znajduje się w Warunkach użytkowania.
Wyłączenie odpowiedzialności
Informacje i publikacje nie stanowią i nie powinny być traktowane jako porady finansowe, inwestycyjne, tradingowe ani jakiekolwiek inne rekomendacje dostarczane lub zatwierdzone przez TradingView. Więcej informacji znajduje się w Warunkach użytkowania.