
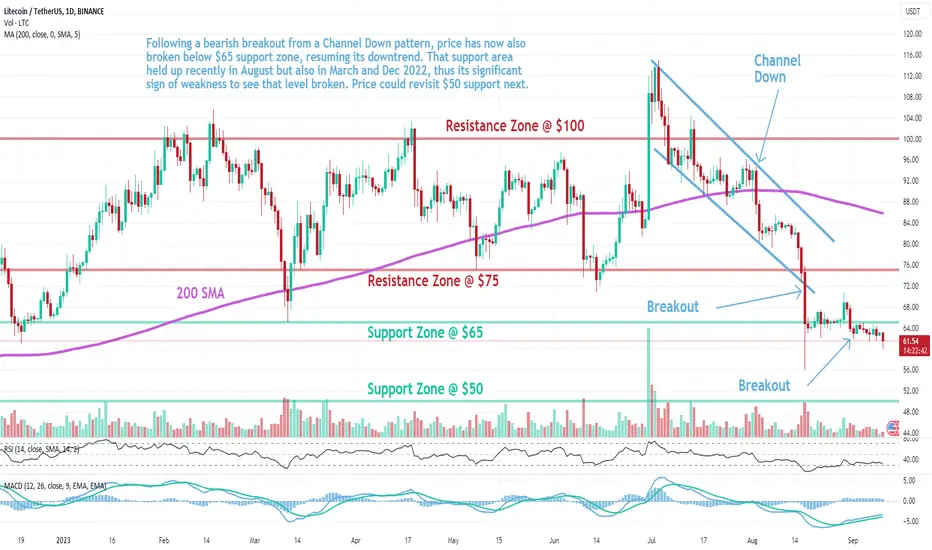
Litecoin (LTC) technical analysis:
Trade setup: Following a bearish breakout from a Channel Down pattern, price has now also broken below $65 support zone, resuming its downtrend. That support area held up recently in August but also in March and Dec 2022, thus its significant sign of weakness to see that level broken. Price could revisit $50 support next.
Trend: Downtrend across all time horizons (Short- Medium- and Long-Term).
Momentum is Mixed as MACD Line is above MACD Signal Line (Bullish) but RSI < 45 (Bearish).
Support and Resistance: Nearest Support Zone is $65, which it broke, then $50. The nearest Resistance Zone is $75 (previous support), then $100.

Wyłączenie odpowiedzialności
Informacje i publikacje nie stanowią i nie powinny być traktowane jako porady finansowe, inwestycyjne, tradingowe ani jakiekolwiek inne rekomendacje dostarczane lub zatwierdzone przez TradingView. Więcej informacji znajduje się w Warunkach użytkowania.
Wyłączenie odpowiedzialności
Informacje i publikacje nie stanowią i nie powinny być traktowane jako porady finansowe, inwestycyjne, tradingowe ani jakiekolwiek inne rekomendacje dostarczane lub zatwierdzone przez TradingView. Więcej informacji znajduje się w Warunkach użytkowania.