MATIC/BTC 1D Short Term
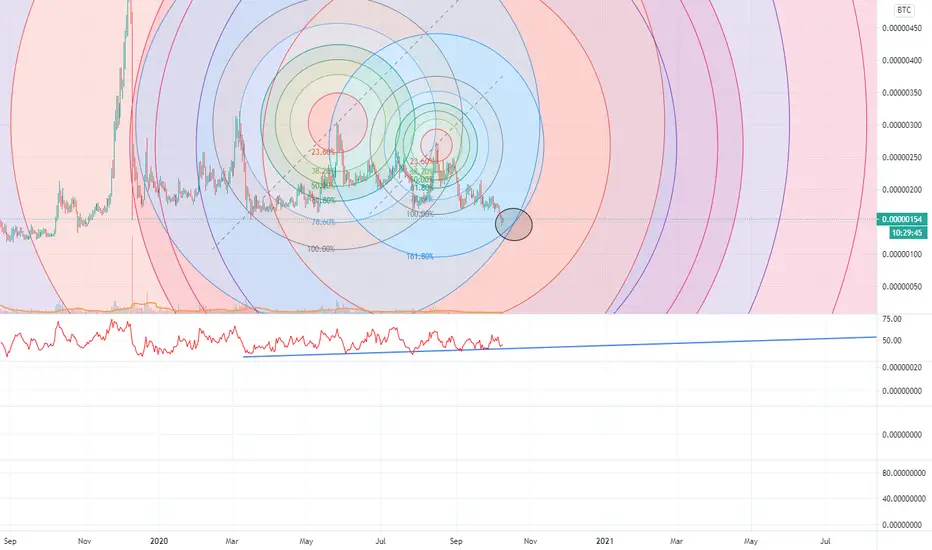
Short term we will drop to 140 sat area, see dark circle that indicates a support/resistance area. After that a rise is possible back to 170 sat area for the first target.
Also see the ultimate oscillator here. The line below the indicator indicates a last drop back to the line, before rising again.
No advice from me, i just look at the charts :)
Also see the ultimate oscillator here. The line below the indicator indicates a last drop back to the line, before rising again.
No advice from me, i just look at the charts :)

Wyłączenie odpowiedzialności
Informacje i publikacje nie stanowią i nie powinny być traktowane jako porady finansowe, inwestycyjne, tradingowe ani jakiekolwiek inne rekomendacje dostarczane lub zatwierdzone przez TradingView. Więcej informacji znajduje się w Warunkach użytkowania.
Wyłączenie odpowiedzialności
Informacje i publikacje nie stanowią i nie powinny być traktowane jako porady finansowe, inwestycyjne, tradingowe ani jakiekolwiek inne rekomendacje dostarczane lub zatwierdzone przez TradingView. Więcej informacji znajduje się w Warunkach użytkowania.