MCOUSD
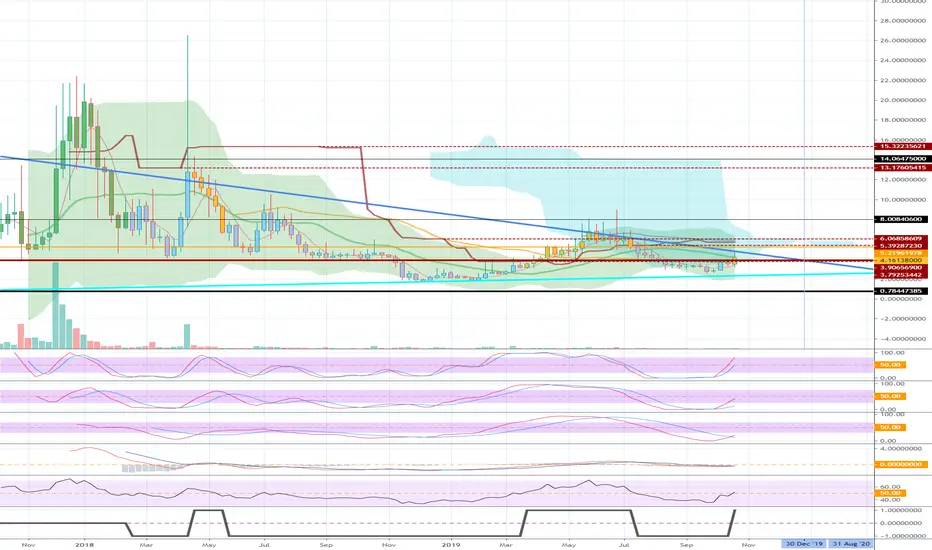
The MCO, a chart published for next year's profits, also rose above the basic 3.90656900 following the rise in BTC.
The price is currently forming around 20MA on the weekly chart.
Once the downtrend line is out and the stock splits slowly between the uptrend line and 3.90656900, we expect good results next year.
The price is currently forming around 20MA on the weekly chart.
Once the downtrend line is out and the stock splits slowly between the uptrend line and 3.90656900, we expect good results next year.

[Practical trading strategy using HA-MS and SBOD]
youtu.be/aceN1AttX1Y
youtu.be/aceN1AttX1Y
Powiązane publikacje
Wyłączenie odpowiedzialności
Informacje i publikacje nie stanowią i nie powinny być traktowane jako porady finansowe, inwestycyjne, tradingowe ani jakiekolwiek inne rekomendacje dostarczane lub zatwierdzone przez TradingView. Więcej informacji znajduje się w Warunkach użytkowania.