MESM Apr 28: Fresh high, but 7180 is the weakness trigger
MESM analysis for Tuesday, April 28
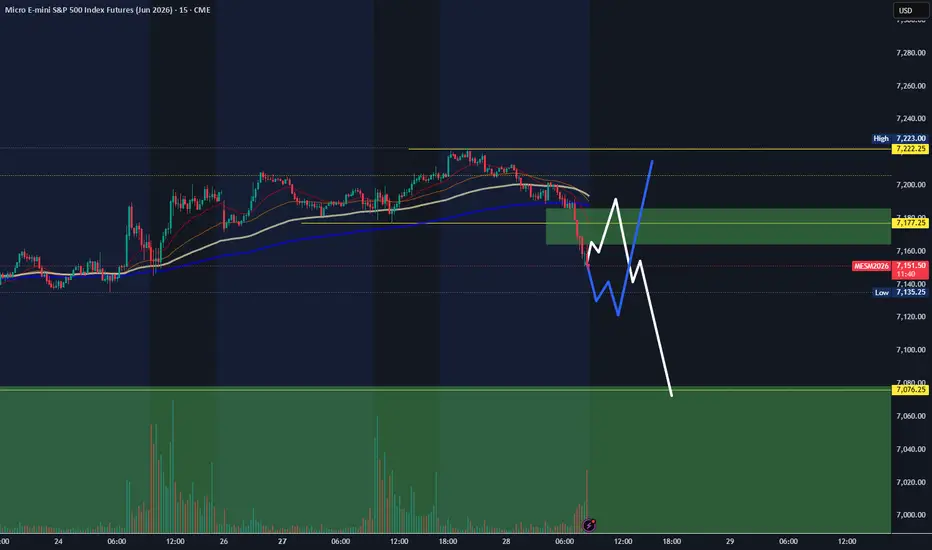
MESM is trading around 7150 after making a fresh overnight high near 7223. Even with that fresh high, the current 4H candle is printing strong red, so I want to stay careful here.
The bigger weekly level I’m still watching is 7076. That weekly fair value gap is still in play for me, so I’m keeping it marked as an important downside reference for this week.
On the 4H chart, the key level for me is 7180. If the current candle closes below that area, then I think it would confirm more pullback potential, and in that case I’ll be watching for continuation lower toward 7076.
On the 1H chart, there is a fair value gap cluster inside the green highlighted zone. That makes this area important for any short-term reaction.
On the 15M chart, several fair value gaps are stacking together in that same zone, so before any deeper downside move, there is a good chance price may bounce into that cluster first.
Key levels
7223 = overnight high / upside liquidity
7180 = 4H weakness trigger
FVG cluster = short-term reaction zone
7076 = weekly fair value gap / downside target
So for today, my plan is:
Watch 7180 for weakness confirmation
Watch the FVG cluster for a possible bounce first
If sellers stay in control after that, watch for continuation toward 7076
Not financial advice. No confirmation, no trade. MESM2026
MESM is trading around 7150 after making a fresh overnight high near 7223. Even with that fresh high, the current 4H candle is printing strong red, so I want to stay careful here.
The bigger weekly level I’m still watching is 7076. That weekly fair value gap is still in play for me, so I’m keeping it marked as an important downside reference for this week.
On the 4H chart, the key level for me is 7180. If the current candle closes below that area, then I think it would confirm more pullback potential, and in that case I’ll be watching for continuation lower toward 7076.
On the 1H chart, there is a fair value gap cluster inside the green highlighted zone. That makes this area important for any short-term reaction.
On the 15M chart, several fair value gaps are stacking together in that same zone, so before any deeper downside move, there is a good chance price may bounce into that cluster first.
Key levels
7223 = overnight high / upside liquidity
7180 = 4H weakness trigger
FVG cluster = short-term reaction zone
7076 = weekly fair value gap / downside target
So for today, my plan is:
Watch 7180 for weakness confirmation
Watch the FVG cluster for a possible bounce first
If sellers stay in control after that, watch for continuation toward 7076
Not financial advice. No confirmation, no trade.
MESM2026 
Wyłączenie odpowiedzialności
Informacje i publikacje nie stanowią i nie powinny być traktowane jako porady finansowe, inwestycyjne, tradingowe ani jakiekolwiek inne rekomendacje dostarczane lub zatwierdzone przez TradingView. Więcej informacji znajduje się w Warunkach użytkowania.
Wyłączenie odpowiedzialności
Informacje i publikacje nie stanowią i nie powinny być traktowane jako porady finansowe, inwestycyjne, tradingowe ani jakiekolwiek inne rekomendacje dostarczane lub zatwierdzone przez TradingView. Więcej informacji znajduje się w Warunkach użytkowania.