MESM May 7: Bullish above 7377, watching 7410 and 7300
MESM analysis for Thursday, May 7
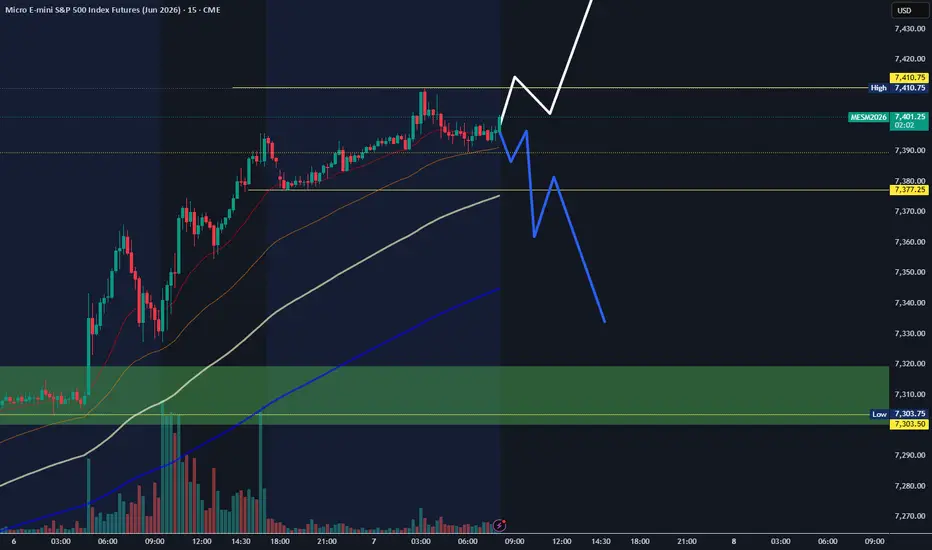
MESM is trading around 7400 after printing a strong series of green candles, so the higher-time-frame structure still looks bullish.
On the 4H chart, the main upside liquidity I’m watching is the fresh high around 7410. If bulls stay in control, that is the next level I want to see tested.
If price pulls back, then the major support area I’m watching is 7300. For me, that would be the bigger zone where buyers could step back in and potentially bounce price back toward the highs.
On the 1H chart, there is a cluster zone lining up between the 1-hour order block and the larger 4-hour support area. That makes the green highlighted zone very important if price starts retracing.
On the 15M chart, the key intraday support is 7377. If I want to stay bullish today, then I do not want to see 15-minute candles closing below that level. If 7377 fails, then I’ll be watching for a deeper retracement into 7300.
Key levels
7410 = fresh high / upside liquidity
7377 = key intraday support
7300 = major pullback zone
Green zone = 1H order block + support cluster
So for today, my plan is:
Stay constructive while price holds above 7377
Watch for continuation into 7410
If 7377 breaks, watch for a deeper pullback into 7300
Not financial advice. No confirmation, no trade. MESM2026
MESM is trading around 7400 after printing a strong series of green candles, so the higher-time-frame structure still looks bullish.
On the 4H chart, the main upside liquidity I’m watching is the fresh high around 7410. If bulls stay in control, that is the next level I want to see tested.
If price pulls back, then the major support area I’m watching is 7300. For me, that would be the bigger zone where buyers could step back in and potentially bounce price back toward the highs.
On the 1H chart, there is a cluster zone lining up between the 1-hour order block and the larger 4-hour support area. That makes the green highlighted zone very important if price starts retracing.
On the 15M chart, the key intraday support is 7377. If I want to stay bullish today, then I do not want to see 15-minute candles closing below that level. If 7377 fails, then I’ll be watching for a deeper retracement into 7300.
Key levels
7410 = fresh high / upside liquidity
7377 = key intraday support
7300 = major pullback zone
Green zone = 1H order block + support cluster
So for today, my plan is:
Stay constructive while price holds above 7377
Watch for continuation into 7410
If 7377 breaks, watch for a deeper pullback into 7300
Not financial advice. No confirmation, no trade.
MESM2026 
Wyłączenie odpowiedzialności
Informacje i publikacje nie stanowią i nie powinny być traktowane jako porady finansowe, inwestycyjne, tradingowe ani jakiekolwiek inne rekomendacje dostarczane lub zatwierdzone przez TradingView. Więcej informacji znajduje się w Warunkach użytkowania.
Wyłączenie odpowiedzialności
Informacje i publikacje nie stanowią i nie powinny być traktowane jako porady finansowe, inwestycyjne, tradingowe ani jakiekolwiek inne rekomendacje dostarczane lub zatwierdzone przez TradingView. Więcej informacji znajduje się w Warunkach użytkowania.