
Every SMC chart has them: boxes drawn where a strong move started, and a promise that price will react when it comes back.
I have a free indicator that draws exactly those boxes, so I owe it an honest answer. Do order blocks matter, or would any box drawn the same size, in the same place relative to price, do just as well?

HOW I TESTED IT
Three years of gold, 1 minute bars, on two feeds: CME futures and spot. Every 4 hour and daily order block my script detected, around 330 per feed that price came back to.
For each one I drew two fake zones. Same height, same distance from price. One mirrored to the other side of price at the moment the real block appeared. One planted at a random moment, two to sixty days earlier or later.
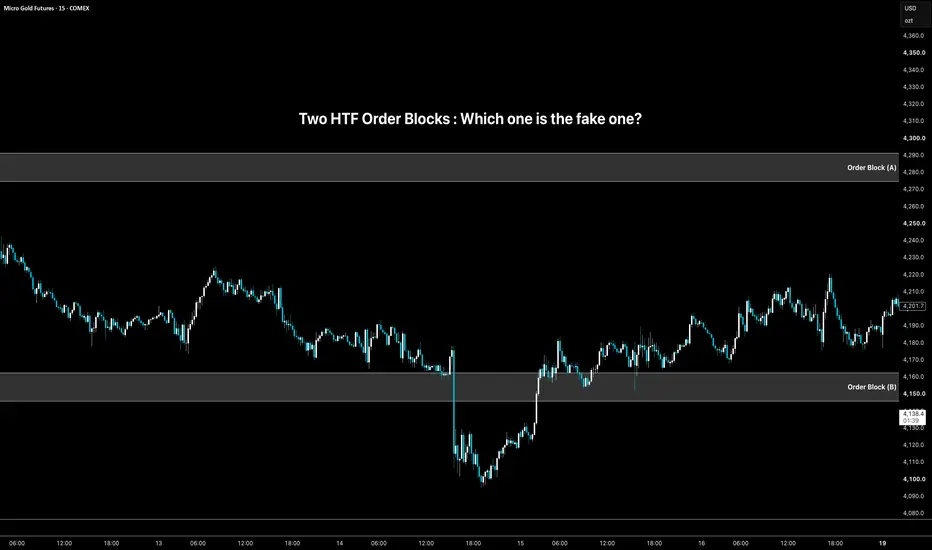
The chart above is one of them. B is the real 4 hour order block. A is its mirror: same height, same distance from price, on the other side. B was touched on October 14 and counted as a hold: price bounced one hourly ATR. Fifteen minutes later it fell $70 straight through B. A hold in this test means the first reaction, nothing more.
Then the same question for all three, at the first touch: does price move one hourly ATR away from the zone before a 5 minute candle closes beyond its far edge? Call it a hold.
THE RESULT
Real order blocks held 65% of the time on both feeds. The fakes held 55% to 61%.
So yes, they matter. Not by much. About three to eleven points, and how much depends on when you look. In the last two years the gap was 7 to 12 points on both feeds. In the eighteen months before that, it was close to nothing.
I wrote my pass mark down before running anything: the gap had to hold in both halves of the three years. It didn't. The early half failed on both feeds.

WHAT ABOUT SMALLER TIMEFRAMES?
The same test on 5 minute and 15 minute blocks, with thousands of touches, came out at one to three points. A 15 minute order block is close to a random line. 1 hour sat in between, three to eight.
The gap grows with the timeframe. The higher the block, the more it means. That part matches the textbooks.
AND THE OVERLAP ZONES?
The indicator also marks places where blocks from different timeframes stack on top of each other, the zones most people treat as A+. They did no better than a single 4 hour block. Three or more stacked did no better than two.
AGAINST THE TREND?
I expected the edge to be all trend: buy zones holding in a rising market. On gold it wasn't. Blocks against the daily trend held as often as blocks with it, and still beat their fakes by 7 to 12 points.
THE PART THAT MATTERS FOR TRADING
A higher hold rate isn't money yet. So I turned every touch into the bluntest possible trade. Limit at the zone's edge, stop just past the far edge, target one hourly ATR, no filter of any kind.
Fake zones: minus 0.04 to minus 0.12R a trade after costs.
Real order blocks: break-even. Plus 0.00 on spot, minus 0.04 on futures.

That's the honest size of it. An order block turns a losing blind trade into a break-even one. It's a better place to look than a random level, and a worse place to stop thinking.
WHAT STAYS WITH ME
I grew up on the idea that these zones are where price turns. On their own, they aren't. Price runs through a real order block about a third of the time, and a box drawn by rule, with no meaning behind it, holds more than half the time.
So the box is not the edge. But it is a better level than a random one: it lifts a blind trade from a small loss to break-even. That makes it worth keeping on the chart, as a place to look, not a reason to enter.
Whatever makes money on top of it comes from somewhere else: which block you pick, when you take it, how you manage the trade. That part isn't in the box. It's in you.
If you use order blocks, try this on your own chart: draw a fake box the same size on the other side of price and watch both for a month. If you can't tell them apart, neither can the market.
The script on the chart is Higher Timeframe Order Blocks by PINE DIGGA, free and mine. The fake zones in the images are drawn by hand; so are the real ones that broke, because the script removes a zone once a candle closes through it.
Notes: costs are $0.30 per round trip on gold; futures are the front contract, back-adjusted at each roll; the last two years were looked at separately after the three-year test, so treat that split as a second look, not proof. This is what happened, not a forecast.
Have you ever tested your zones against random ones?
Not financial advice, just what the numbers showed me.
I have a free indicator that draws exactly those boxes, so I owe it an honest answer. Do order blocks matter, or would any box drawn the same size, in the same place relative to price, do just as well?
HOW I TESTED IT
Three years of gold, 1 minute bars, on two feeds: CME futures and spot. Every 4 hour and daily order block my script detected, around 330 per feed that price came back to.
For each one I drew two fake zones. Same height, same distance from price. One mirrored to the other side of price at the moment the real block appeared. One planted at a random moment, two to sixty days earlier or later.
The chart above is one of them. B is the real 4 hour order block. A is its mirror: same height, same distance from price, on the other side. B was touched on October 14 and counted as a hold: price bounced one hourly ATR. Fifteen minutes later it fell $70 straight through B. A hold in this test means the first reaction, nothing more.
Then the same question for all three, at the first touch: does price move one hourly ATR away from the zone before a 5 minute candle closes beyond its far edge? Call it a hold.
THE RESULT
Real order blocks held 65% of the time on both feeds. The fakes held 55% to 61%.
So yes, they matter. Not by much. About three to eleven points, and how much depends on when you look. In the last two years the gap was 7 to 12 points on both feeds. In the eighteen months before that, it was close to nothing.
I wrote my pass mark down before running anything: the gap had to hold in both halves of the three years. It didn't. The early half failed on both feeds.
WHAT ABOUT SMALLER TIMEFRAMES?
The same test on 5 minute and 15 minute blocks, with thousands of touches, came out at one to three points. A 15 minute order block is close to a random line. 1 hour sat in between, three to eight.
The gap grows with the timeframe. The higher the block, the more it means. That part matches the textbooks.
AND THE OVERLAP ZONES?
The indicator also marks places where blocks from different timeframes stack on top of each other, the zones most people treat as A+. They did no better than a single 4 hour block. Three or more stacked did no better than two.
AGAINST THE TREND?
I expected the edge to be all trend: buy zones holding in a rising market. On gold it wasn't. Blocks against the daily trend held as often as blocks with it, and still beat their fakes by 7 to 12 points.
THE PART THAT MATTERS FOR TRADING
A higher hold rate isn't money yet. So I turned every touch into the bluntest possible trade. Limit at the zone's edge, stop just past the far edge, target one hourly ATR, no filter of any kind.
Fake zones: minus 0.04 to minus 0.12R a trade after costs.
Real order blocks: break-even. Plus 0.00 on spot, minus 0.04 on futures.
That's the honest size of it. An order block turns a losing blind trade into a break-even one. It's a better place to look than a random level, and a worse place to stop thinking.
WHAT STAYS WITH ME
I grew up on the idea that these zones are where price turns. On their own, they aren't. Price runs through a real order block about a third of the time, and a box drawn by rule, with no meaning behind it, holds more than half the time.
So the box is not the edge. But it is a better level than a random one: it lifts a blind trade from a small loss to break-even. That makes it worth keeping on the chart, as a place to look, not a reason to enter.
Whatever makes money on top of it comes from somewhere else: which block you pick, when you take it, how you manage the trade. That part isn't in the box. It's in you.
If you use order blocks, try this on your own chart: draw a fake box the same size on the other side of price and watch both for a month. If you can't tell them apart, neither can the market.
The script on the chart is Higher Timeframe Order Blocks by PINE DIGGA, free and mine. The fake zones in the images are drawn by hand; so are the real ones that broke, because the script removes a zone once a candle closes through it.
Notes: costs are $0.30 per round trip on gold; futures are the front contract, back-adjusted at each roll; the last two years were looked at separately after the three-year test, so treat that split as a second look, not proof. This is what happened, not a forecast.
Have you ever tested your zones against random ones?
Not financial advice, just what the numbers showed me.

PINE DIGGA · Measured indicators for gold, crypto and the Nasdaq · pinedigga.com
Powiązane publikacje
Wyłączenie odpowiedzialności
Informacje i publikacje nie stanowią i nie powinny być traktowane jako porady finansowe, inwestycyjne, tradingowe ani jakiekolwiek inne rekomendacje dostarczane lub zatwierdzone przez TradingView. Więcej informacji znajduje się w Warunkach użytkowania.