Microsoft ( MSFT) Weekly: Testing 200 EMA Support Floor – Two Potential Asymmetric Long Blueprints
### 💻 Microsoft Corp. (MSFT) Weekly Technical Matrix (Ref: MSFT_2026-06-16_10-34-28.png)
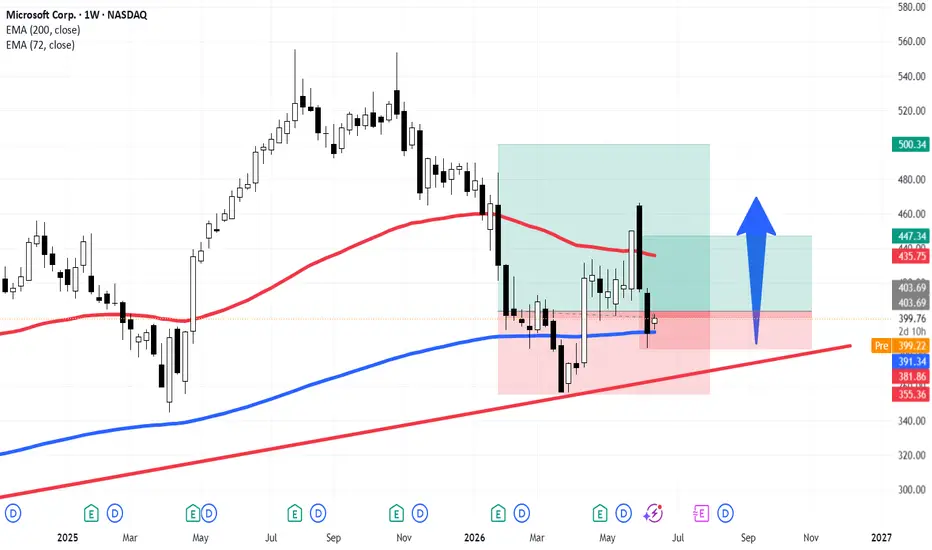
We are analyzing Microsoft Corp. (MSFT - NASDAQ) on the Weekly (1W) macro timeframe, as price action interacts directly with a major institutional demand zone.
The stock is currently trading up **+2.31% at 399.76**, sitting directly on top of the long-term **200-period EMA (blue line at 391.34)**. Given this significant dynamic support intersection, we have formulated two distinct long playbooks based on different risk-profiles and mathematical objectives.
---
### 🔎 Strategy Blueprint 1: Technical Mean-Reversion (Shorter-Term / Higher Local Risk)
* **The Setup:** This approach capitalizes on the immediate confluence between the 200 EMA and the long-term Ascending Trendline (LTA - lower diagonal red line).
* **Risk Parameters:** This trade features a tight protective stop-loss anchored right below the recent structural low at **381.86**.
* **Target Horizon:** The target is a quick rotational bounce back toward the descending **72-period EMA (red line at 435.75)** and the local liquidity level at **447.34**. While it offers a very accessible **1:1 Risk/Reward ratio** to lock in profits, it carries a slightly lower mathematical probability of extended expansion straight into 2:1 RR without consolidation.
### 🎯 Strategy Blueprint 2: Macro Swing Expansion (Longer-Term Position)
* **The Setup:** This blueprint maps out a broader structural recovery, position-trading the asset back up toward its major historical high-value zone.
* **Target Horizon:** The ultimate objective targets the upper green horizontal resistance layer at **500.34**.
* **The Warning Signal:** Caution is warranted. The market has printed **two highly aggressive, wide-range bearish weekly candles** leading into this support. This heavy selling momentum indicates that institutional distribution is still stabilizing, and price may require an accumulation phase or a liquidity sweep before validating a multi-week upward reversal.
---
### 📊 System Philosophy & Edge Probability
At **ChartPro Data**, we reinforce that no technical setup guarantees a future outcome. Our methodology does not attempt to predict the market; instead, we systematically locate structural edge zones where the historical win rate combined with a solid **2:1 Risk/Reward profile** tilts the mathematical expectancy firmly in our favor over a series of executions.
Let the weekly candle close define the structural validation before executing allocation sizes.
---
📊 **ChartPro Data** | By Rogerio Zaglia
*Equity Architecture, Macro Technical Research & Systematic Risk Engineering.*
⚠️ **Disclaimer:** For educational and informational purposes only. This technical analysis represents a personal trading framework and does not constitute financial or investment advice.
MSFT) Weekly: Testing 200 EMA Support Floor – Two Potential Asymmetric Long Blueprints### 💻 Microsoft Corp. (
MSFT) Weekly Technical Matrix (Ref: MSFT_2026-06-16_10-34-28.png)We are analyzing Microsoft Corp. (
MSFT - NASDAQ) on the Weekly (1W) macro timeframe, as price action interacts directly with a major institutional demand zone. The stock is currently trading up **+2.31% at 399.76**, sitting directly on top of the long-term **200-period EMA (blue line at 391.34)**. Given this significant dynamic support intersection, we have formulated two distinct long playbooks based on different risk-profiles and mathematical objectives.
---
### 🔎 Strategy Blueprint 1: Technical Mean-Reversion (Shorter-Term / Higher Local Risk)
* **The Setup:** This approach capitalizes on the immediate confluence between the 200 EMA and the long-term Ascending Trendline (LTA - lower diagonal red line).
* **Risk Parameters:** This trade features a tight protective stop-loss anchored right below the recent structural low at **381.86**.
* **Target Horizon:** The target is a quick rotational bounce back toward the descending **72-period EMA (red line at 435.75)** and the local liquidity level at **447.34**. While it offers a very accessible **1:1 Risk/Reward ratio** to lock in profits, it carries a slightly lower mathematical probability of extended expansion straight into 2:1 RR without consolidation.
### 🎯 Strategy Blueprint 2: Macro Swing Expansion (Longer-Term Position)
* **The Setup:** This blueprint maps out a broader structural recovery, position-trading the asset back up toward its major historical high-value zone.
* **Target Horizon:** The ultimate objective targets the upper green horizontal resistance layer at **500.34**.
* **The Warning Signal:** Caution is warranted. The market has printed **two highly aggressive, wide-range bearish weekly candles** leading into this support. This heavy selling momentum indicates that institutional distribution is still stabilizing, and price may require an accumulation phase or a liquidity sweep before validating a multi-week upward reversal.
---
### 📊 System Philosophy & Edge Probability
At **ChartPro Data**, we reinforce that no technical setup guarantees a future outcome. Our methodology does not attempt to predict the market; instead, we systematically locate structural edge zones where the historical win rate combined with a solid **2:1 Risk/Reward profile** tilts the mathematical expectancy firmly in our favor over a series of executions.
Let the weekly candle close define the structural validation before executing allocation sizes.
---
📊 **ChartPro Data** | By Rogerio Zaglia
*Equity Architecture, Macro Technical Research & Systematic Risk Engineering.*
⚠️ **Disclaimer:** For educational and informational purposes only. This technical analysis represents a personal trading framework and does not constitute financial or investment advice.

Wyłączenie odpowiedzialności
Informacje i publikacje nie stanowią i nie powinny być traktowane jako porady finansowe, inwestycyjne, tradingowe ani jakiekolwiek inne rekomendacje dostarczane lub zatwierdzone przez TradingView. Więcej informacji znajduje się w Warunkach użytkowania.
Wyłączenie odpowiedzialności
Informacje i publikacje nie stanowią i nie powinny być traktowane jako porady finansowe, inwestycyjne, tradingowe ani jakiekolwiek inne rekomendacje dostarczane lub zatwierdzone przez TradingView. Więcej informacji znajduje się w Warunkach użytkowania.