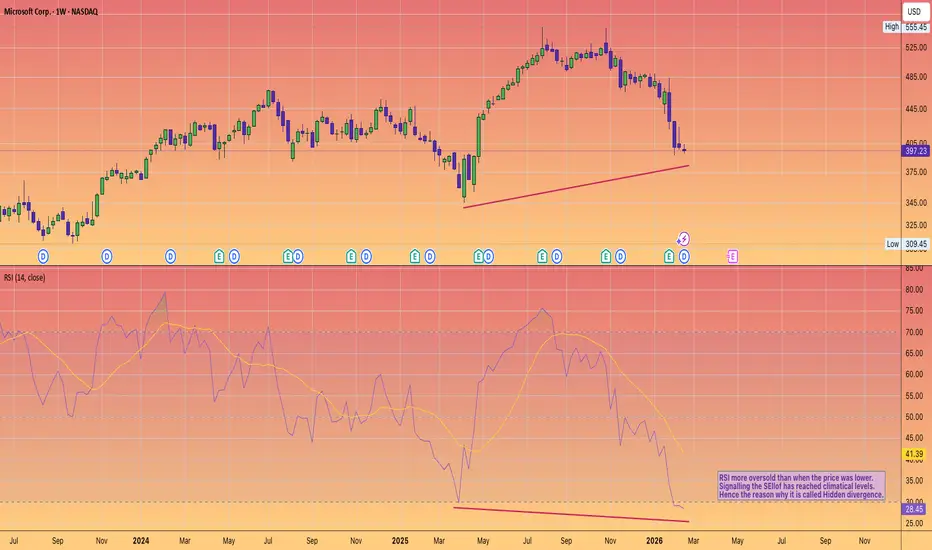
Microsoft is indeed in a fascinating spot.
While the price has retreated from its late-2025 highs (around $540-$550), the long-term structural integrity remains intact.
What the Chart is Telling Us:
A hidden bullish divergence occurs during a pullback in an existing uptrend.
The Higher Low: Despite the "SaaSpocalypse" volatility earlier this year and concerns over AI CapEx, MSFT could potentially form a base around the $395 - $400 psychological support zone.
The "selling momentum" looks intense on the indicator, the actual price isn't falling as far as the momentum would suggest. It’s often a sign that the bears are exhausted and the primary uptrend is ready to resume.
MSFT is navigating some "heavy" overhead supply.
$400 Psychological SupportThe "line in the sand" where buyers have recently stepped in.
$427 - $433 Immediate Resistance Convergence of the 20-day SMA and the 200-day SMA.
A break above here confirms the reversal.
$462Key Resistance The 50-day SMA; clearing this would likely signal a run back toward the $500 mark.
Note: Many institutional analysts (like Morgan Stanley) still hold price targets in the $600+ range for 2026, viewing this current technical "washout" as a deep-value opportunity despite the recent downtrend.
****Not financial advice****
Especially when the trend has been so strong to downside.
(Which I did suggest could happen after the double top trigger.)
Reversal trading has blown up many retail accounts.
While the price has retreated from its late-2025 highs (around $540-$550), the long-term structural integrity remains intact.
What the Chart is Telling Us:
A hidden bullish divergence occurs during a pullback in an existing uptrend.
The Higher Low: Despite the "SaaSpocalypse" volatility earlier this year and concerns over AI CapEx,
MSFT could potentially form a base around the $395 - $400 psychological support zone. The "selling momentum" looks intense on the indicator, the actual price isn't falling as far as the momentum would suggest. It’s often a sign that the bears are exhausted and the primary uptrend is ready to resume.
MSFT is navigating some "heavy" overhead supply.$400 Psychological SupportThe "line in the sand" where buyers have recently stepped in.
$427 - $433 Immediate Resistance Convergence of the 20-day SMA and the 200-day SMA.
A break above here confirms the reversal.
$462Key Resistance The 50-day SMA; clearing this would likely signal a run back toward the $500 mark.
Note: Many institutional analysts (like Morgan Stanley) still hold price targets in the $600+ range for 2026, viewing this current technical "washout" as a deep-value opportunity despite the recent downtrend.
****Not financial advice****
Especially when the trend has been so strong to downside.
(Which I did suggest could happen after the double top trigger.)
Reversal trading has blown up many retail accounts.
Uwaga
Daily chart
Wyłączenie odpowiedzialności
Informacje i publikacje nie stanowią i nie powinny być traktowane jako porady finansowe, inwestycyjne, tradingowe ani jakiekolwiek inne rekomendacje dostarczane lub zatwierdzone przez TradingView. Więcej informacji znajduje się w Warunkach użytkowania.
Wyłączenie odpowiedzialności
Informacje i publikacje nie stanowią i nie powinny być traktowane jako porady finansowe, inwestycyjne, tradingowe ani jakiekolwiek inne rekomendacje dostarczane lub zatwierdzone przez TradingView. Więcej informacji znajduje się w Warunkach użytkowania.