
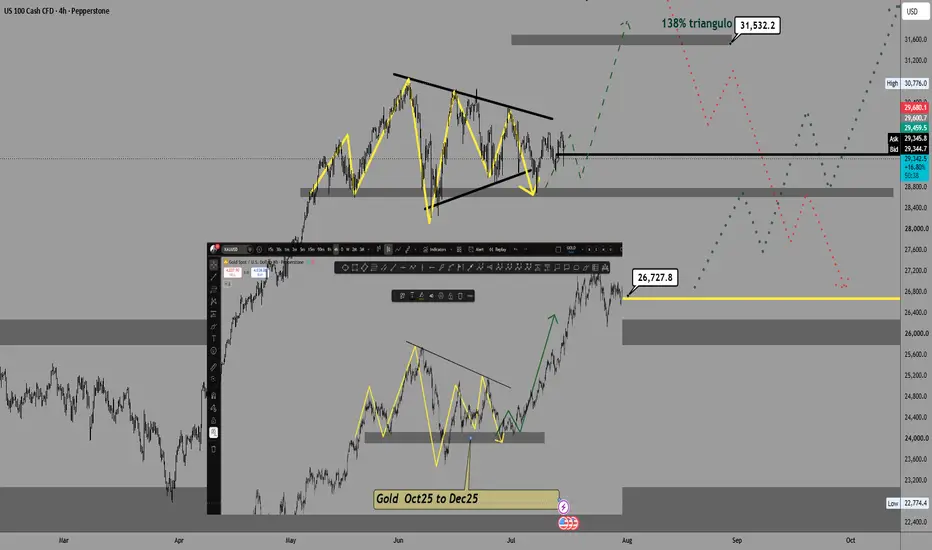
I’ve been observing a very interesting structure in the Nasdaq (NAS100) since May 26th. Upon comparing the charts, I’ve noticed a remarkable technical correlation with the formation that Gold (XAU/USD) displayed between October and December of last year.
As you can see in the chart, the consolidation/triangle pattern is almost a mirror image. If the market respects this fractal structure, we could be looking at a bullish continuation signal similar to the one Gold executed back then.
What do you think? Are we seeing a repetition of algorithmic behavior, or just a technical coincidence? Let me know your thoughts in the comments.
As you can see in the chart, the consolidation/triangle pattern is almost a mirror image. If the market respects this fractal structure, we could be looking at a bullish continuation signal similar to the one Gold executed back then.
What do you think? Are we seeing a repetition of algorithmic behavior, or just a technical coincidence? Let me know your thoughts in the comments.

Wyłączenie odpowiedzialności
Informacje i publikacje nie stanowią i nie powinny być traktowane jako porady finansowe, inwestycyjne, tradingowe ani jakiekolwiek inne rekomendacje dostarczane lub zatwierdzone przez TradingView. Więcej informacji znajduje się w Warunkach użytkowania.
Wyłączenie odpowiedzialności
Informacje i publikacje nie stanowią i nie powinny być traktowane jako porady finansowe, inwestycyjne, tradingowe ani jakiekolwiek inne rekomendacje dostarczane lub zatwierdzone przez TradingView. Więcej informacji znajduje się w Warunkach użytkowania.