
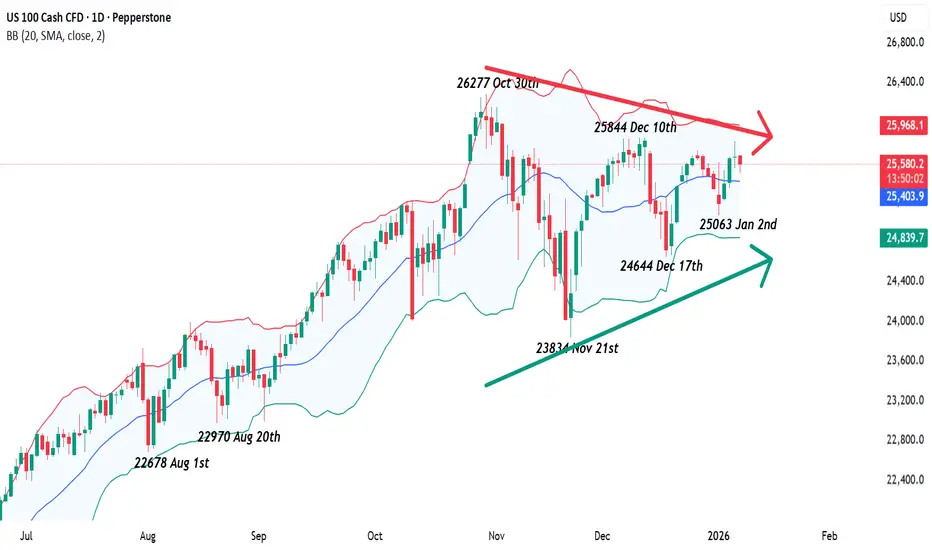
While the US 100 has made a solid start to 2026, registering a 1% gain in its first 5 days of trading, it has yet to surpass its previous record high of 26277 hit on October 30th. This contrasts with the US 500 and US 30 which both hit new peaks on Tuesday, January 6th, with both popular indices seeming to have benefitted from a broadening of the rally away from AI into other sectors of the economy.
Whether this trend continues into the weekend and early next week could now depend on the outcome of tomorrow’s US Non-farm payrolls release which may help traders determine not only the current health of the labour market and US economy, but more importantly, impact their expectations for the next series of Federal Reserve interest rate decisions.
A stronger than expected payrolls release, while good news for the economy, could weigh on technology stocks in the US 100, as it could imply the Fed may delay further rate cuts until later in 2026, while a weaker than expected number could mean the opposite.
In this regard, the price action post the payrolls release may well be crucial tomorrow. Early moves at the start of a new year can often be wrong, as traders rush to deploy new capital before the wider market gets to assess the macro-outlook. Currently, market expectations are for 2 further interest rate cuts from the Federal Reserve in 2026, which contrasts with Fed policymakers which only see 1. Tomorrow’s data could help clarify which is more likely with a potential knock-on impact for the direction of the US 100.
Technical Update: Decision Making Process Dominates Start of 2026
After the sharp 9.30% drop in the US 100 index from the October 30th high at 26277 to the November 21st low of 23834, the market has mostly moved sideways. These two levels have continued to hold prices in place, indicating a more balanced trading assessment for the past two and a half months.

As the chart above shows, the US 100 index has been making lower highs and higher lows in price since the October/November decline. This means sellers are willing to sell at slightly lower levels each time, while buyers are stepping in sooner on each dip. When prices start to converge like this, it forms what technical analysts call a “Symmetrical Triangle.”
Some traders might say this type of pattern usually continues the previous trend, which for the US 100 index was upward. However, trying to guess the direction of a breakout in advance can be risky. With this kind of pattern in place, it can be a safer option to wait for the price to move above the previous high or below the previous low to determine which directional bias may be emerging.
Potential Resistance Levels:
The most recent high that price strength failed at was 25844, which was set on December 10th. This potentially is the first key resistance level to watch in upcoming sessions. While prices stay below 25844, the triangle pattern can continue. However, if the market were to close above 25844, it could lead to a further phase of price strength.
If the market starts to show potential for further upside, a close above 25844 could shift traders’ attention to the next resistance at 26277, which is the high from October 30th, possibly further if this level in turn is breached.
Potential Support Levels:
The most recent low in this possible triangular pattern is 25063, which was set on January 2nd. This is the level where buyers last stepped in, so it could be a key support area inside the Symmetrical Triangle. While prices stay above 25063, it can be suggested that the support remains in place.
However, if prices were to close below 25063, it could be a sign that downside pressure is building, with the next level to watch being 24644, the low from December 17th. If the US 100 were then to close below 24644 as well, it could point to an even deeper move down toward 23834, which is the low from November 21st.
The material provided here has not been prepared accordance with legal requirements designed to promote the independence of investment research and as such is considered to be a marketing communication. Whilst it is not subject to any prohibition on dealing ahead of the dissemination of investment research, we will not seek to take any advantage before providing it to our clients.
Pepperstone doesn’t represent that the material provided here is accurate, current or complete, and therefore shouldn’t be relied upon as such. The information, whether from a third party or not, isn’t to be considered as a recommendation; or an offer to buy or sell; or the solicitation of an offer to buy or sell any security, financial product or instrument; or to participate in any particular trading strategy. It does not take into account readers’ financial situation or investment objectives. We advise any readers of this content to seek their own advice. Without the approval of Pepperstone, reproduction or redistribution of this information isn’t permitted.
Whether this trend continues into the weekend and early next week could now depend on the outcome of tomorrow’s US Non-farm payrolls release which may help traders determine not only the current health of the labour market and US economy, but more importantly, impact their expectations for the next series of Federal Reserve interest rate decisions.
A stronger than expected payrolls release, while good news for the economy, could weigh on technology stocks in the US 100, as it could imply the Fed may delay further rate cuts until later in 2026, while a weaker than expected number could mean the opposite.
In this regard, the price action post the payrolls release may well be crucial tomorrow. Early moves at the start of a new year can often be wrong, as traders rush to deploy new capital before the wider market gets to assess the macro-outlook. Currently, market expectations are for 2 further interest rate cuts from the Federal Reserve in 2026, which contrasts with Fed policymakers which only see 1. Tomorrow’s data could help clarify which is more likely with a potential knock-on impact for the direction of the US 100.
Technical Update: Decision Making Process Dominates Start of 2026
After the sharp 9.30% drop in the US 100 index from the October 30th high at 26277 to the November 21st low of 23834, the market has mostly moved sideways. These two levels have continued to hold prices in place, indicating a more balanced trading assessment for the past two and a half months.
As the chart above shows, the US 100 index has been making lower highs and higher lows in price since the October/November decline. This means sellers are willing to sell at slightly lower levels each time, while buyers are stepping in sooner on each dip. When prices start to converge like this, it forms what technical analysts call a “Symmetrical Triangle.”
Some traders might say this type of pattern usually continues the previous trend, which for the US 100 index was upward. However, trying to guess the direction of a breakout in advance can be risky. With this kind of pattern in place, it can be a safer option to wait for the price to move above the previous high or below the previous low to determine which directional bias may be emerging.
Potential Resistance Levels:
The most recent high that price strength failed at was 25844, which was set on December 10th. This potentially is the first key resistance level to watch in upcoming sessions. While prices stay below 25844, the triangle pattern can continue. However, if the market were to close above 25844, it could lead to a further phase of price strength.
If the market starts to show potential for further upside, a close above 25844 could shift traders’ attention to the next resistance at 26277, which is the high from October 30th, possibly further if this level in turn is breached.
Potential Support Levels:
The most recent low in this possible triangular pattern is 25063, which was set on January 2nd. This is the level where buyers last stepped in, so it could be a key support area inside the Symmetrical Triangle. While prices stay above 25063, it can be suggested that the support remains in place.
However, if prices were to close below 25063, it could be a sign that downside pressure is building, with the next level to watch being 24644, the low from December 17th. If the US 100 were then to close below 24644 as well, it could point to an even deeper move down toward 23834, which is the low from November 21st.
The material provided here has not been prepared accordance with legal requirements designed to promote the independence of investment research and as such is considered to be a marketing communication. Whilst it is not subject to any prohibition on dealing ahead of the dissemination of investment research, we will not seek to take any advantage before providing it to our clients.
Pepperstone doesn’t represent that the material provided here is accurate, current or complete, and therefore shouldn’t be relied upon as such. The information, whether from a third party or not, isn’t to be considered as a recommendation; or an offer to buy or sell; or the solicitation of an offer to buy or sell any security, financial product or instrument; or to participate in any particular trading strategy. It does not take into account readers’ financial situation or investment objectives. We advise any readers of this content to seek their own advice. Without the approval of Pepperstone, reproduction or redistribution of this information isn’t permitted.

Global risk Warning CFDs are complex instruments and come with a high risk of losing money rapidly due to leverage. Between 74-89% of retail investor accounts lose money when trading in CFDs. You should consider whether you understand how CFD
Wyłączenie odpowiedzialności
Informacje i publikacje nie stanowią i nie powinny być traktowane jako porady finansowe, inwestycyjne, tradingowe ani jakiekolwiek inne rekomendacje dostarczane lub zatwierdzone przez TradingView. Więcej informacji znajduje się w Warunkach użytkowania.
Global risk Warning CFDs are complex instruments and come with a high risk of losing money rapidly due to leverage. Between 74-89% of retail investor accounts lose money when trading in CFDs. You should consider whether you understand how CFD
Wyłączenie odpowiedzialności
Informacje i publikacje nie stanowią i nie powinny być traktowane jako porady finansowe, inwestycyjne, tradingowe ani jakiekolwiek inne rekomendacje dostarczane lub zatwierdzone przez TradingView. Więcej informacji znajduje się w Warunkach użytkowania.