
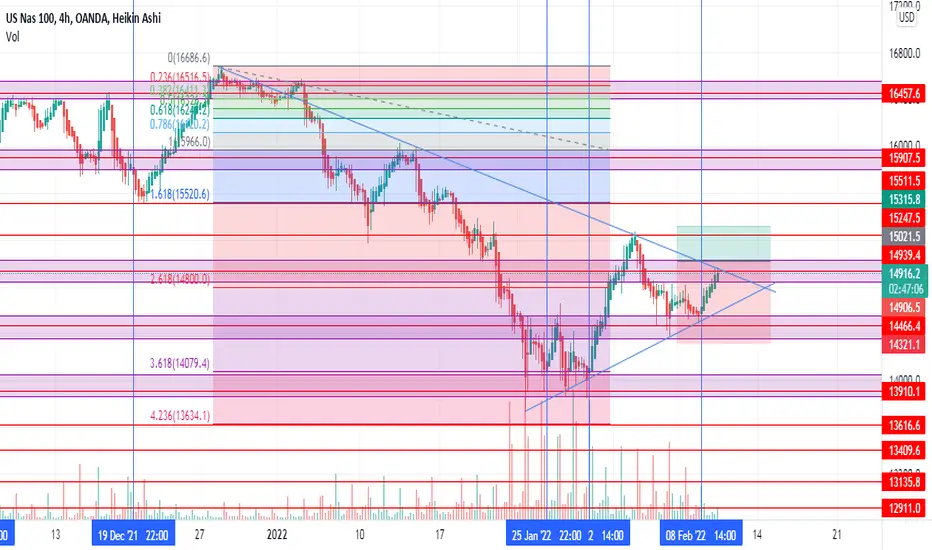
On the Daily timeframe we see a clear downtrend. It touches the trendline more than 5 times, indicating the correct direction of the market. If the market breaks the trendline it should head to the 15072.9 area. On the 4H we see some price action in the key area or golden area, the 618 on the Fibonacci retracement. If it does not break the trendline, it should come down to 14649.3 whhere it should bounce off the trendline and go up.

Wyłączenie odpowiedzialności
Informacje i publikacje nie stanowią i nie powinny być traktowane jako porady finansowe, inwestycyjne, tradingowe ani jakiekolwiek inne rekomendacje dostarczane lub zatwierdzone przez TradingView. Więcej informacji znajduje się w Warunkach użytkowania.
Wyłączenie odpowiedzialności
Informacje i publikacje nie stanowią i nie powinny być traktowane jako porady finansowe, inwestycyjne, tradingowe ani jakiekolwiek inne rekomendacje dostarczane lub zatwierdzone przez TradingView. Więcej informacji znajduje się w Warunkach użytkowania.