US Tech 100 ( NDX) 4H: 200-EMA Dynamic Floor Offers 2RR Tactical Rebound Against Daily Corrective Backdrop
### 🇺🇸 US Tech 100 Cash (NDX / US100) 4H Technical Matrix (Ref: NASDAQ_2026-08-19_08-34-20.png)
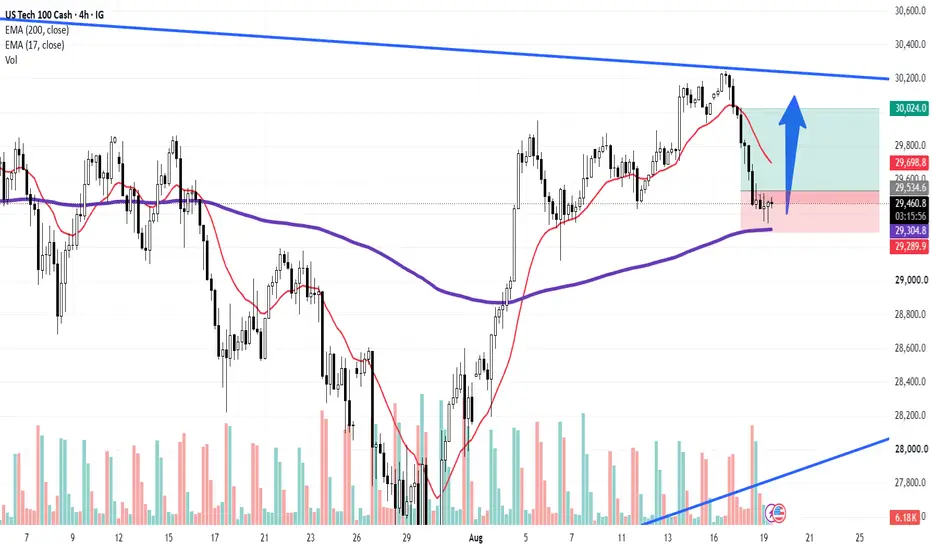
We are releasing an updated 4-Hour (4H) intraday execution study on the US Tech 100 Index (NDX / US100). Following a sharp sell-off from the upper descending trendline (LTB), price action has reached its primary intraday institutional anchor: the **200-period 4H EMA (purple line at 29,305.1)**.
While the Daily (1D) timeframe retains structural room to extend a deeper corrective pullback toward its daily 200-EMA, the immediate confluence on the 4H chart sets up a high-probability asymmetric tactical rebound for a **1:2 Risk-to-Reward (2RR)** reaction trade.
The index is currently stabilizing at **29,492.4 (+0.09%)**, holding right above the 4H 200-EMA floor.
---
### 🔍 Technical Architecture & Multi-Timeframe Mechanics:
Our quantitative setup highlights the tactical 2RR parameters while keeping the macro daily context aligned:
1. **Intraday Institutional Anchor (4H 200-EMA):** Price action has tested the key support floor at **29,305.1**. Buyers are stepping in to defend this moving average, triggering initial accumulation signs.
2. **Tactical Trade Execution Parameters (2RR Setup):**
* **Execution Entry Node:** **29,534.6** (reclaiming intraday buying momentum).
* **Defined Stop-Loss Floor:** **29,289.9** (tight invalidation strictly below the 4H 200-EMA).
* **Upside Target Ceiling (Take Profit):** **30,024.0** (targeting the prior breakdown point and psychological 30k barrier).
3. **Macro Multi-Timeframe Context (Daily Caution):** Traded as a counter-momentum rebound off intraday support. Because the Daily timeframe shows open space for extended retracement, disciplined risk management and strict profit taking at target nodes are mandatory.
---
### 🛡️ Strategic Operational Scenarios:
* **Scenario A — Tactical 4H Rebound Execution (Blue Arrow):** Sustained demand defense above **29,305.1 (4H 200-EMA)** drives a bounce through **29,702.3 (4H 17-EMA)**, extending directly toward the **30,024.0** target zone to fulfill the 2RR setup.
* **Scenario B — Daily Retracement Continuation:** A clean 4H candle close below **29,289.9** invalidates the long setup, confirming that sell-side pressure from the Daily chart is overriding intraday support and opening the door for deeper retracement.
### 📊 Tactical Parameters Summary:
* **Current Bias:** Tactical Intraday Rebound (Tactical Long)
* **Execution Level (Entry):** 29,534.6
* **Risk-Defined Invalidation (Stop Loss):** 29,289.9
* **Primary Rebound Target (Take Profit - 2RR):** 30,024.0
* **Immediate Intraday Resistance (17-EMA 4H):** 29,702.3
* **Institutional Anchor Support (200-EMA 4H):** 29,305.1
---
📊 **ChartPro Data**
*US Tech Equity Architecture, Multi-Timeframe Confluences & Systematic Risk Management.*
⚠️ **Disclaimer:** For educational and informational purposes only. This active market study represents a personal trading framework and does not constitute financial or investment advice.
NDX) 4H: 200-EMA Dynamic Floor Offers 2RR Tactical Rebound Against Daily Corrective Backdrop### 🇺🇸 US Tech 100 Cash (
NDX / US100) 4H Technical Matrix (Ref: NASDAQ_2026-08-19_08-34-20.png)We are releasing an updated 4-Hour (4H) intraday execution study on the US Tech 100 Index (
NDX / US100). Following a sharp sell-off from the upper descending trendline (LTB), price action has reached its primary intraday institutional anchor: the **200-period 4H EMA (purple line at 29,305.1)**.While the Daily (1D) timeframe retains structural room to extend a deeper corrective pullback toward its daily 200-EMA, the immediate confluence on the 4H chart sets up a high-probability asymmetric tactical rebound for a **1:2 Risk-to-Reward (2RR)** reaction trade.
The index is currently stabilizing at **29,492.4 (+0.09%)**, holding right above the 4H 200-EMA floor.
---
### 🔍 Technical Architecture & Multi-Timeframe Mechanics:
Our quantitative setup highlights the tactical 2RR parameters while keeping the macro daily context aligned:
1. **Intraday Institutional Anchor (4H 200-EMA):** Price action has tested the key support floor at **29,305.1**. Buyers are stepping in to defend this moving average, triggering initial accumulation signs.
2. **Tactical Trade Execution Parameters (2RR Setup):**
* **Execution Entry Node:** **29,534.6** (reclaiming intraday buying momentum).
* **Defined Stop-Loss Floor:** **29,289.9** (tight invalidation strictly below the 4H 200-EMA).
* **Upside Target Ceiling (Take Profit):** **30,024.0** (targeting the prior breakdown point and psychological 30k barrier).
3. **Macro Multi-Timeframe Context (Daily Caution):** Traded as a counter-momentum rebound off intraday support. Because the Daily timeframe shows open space for extended retracement, disciplined risk management and strict profit taking at target nodes are mandatory.
---
### 🛡️ Strategic Operational Scenarios:
* **Scenario A — Tactical 4H Rebound Execution (Blue Arrow):** Sustained demand defense above **29,305.1 (4H 200-EMA)** drives a bounce through **29,702.3 (4H 17-EMA)**, extending directly toward the **30,024.0** target zone to fulfill the 2RR setup.
* **Scenario B — Daily Retracement Continuation:** A clean 4H candle close below **29,289.9** invalidates the long setup, confirming that sell-side pressure from the Daily chart is overriding intraday support and opening the door for deeper retracement.
### 📊 Tactical Parameters Summary:
* **Current Bias:** Tactical Intraday Rebound (Tactical Long)
* **Execution Level (Entry):** 29,534.6
* **Risk-Defined Invalidation (Stop Loss):** 29,289.9
* **Primary Rebound Target (Take Profit - 2RR):** 30,024.0
* **Immediate Intraday Resistance (17-EMA 4H):** 29,702.3
* **Institutional Anchor Support (200-EMA 4H):** 29,305.1
---
📊 **ChartPro Data**
*US Tech Equity Architecture, Multi-Timeframe Confluences & Systematic Risk Management.*
⚠️ **Disclaimer:** For educational and informational purposes only. This active market study represents a personal trading framework and does not constitute financial or investment advice.

Wyłączenie odpowiedzialności
Informacje i publikacje nie stanowią i nie powinny być traktowane jako porady finansowe, inwestycyjne, tradingowe ani jakiekolwiek inne rekomendacje dostarczane lub zatwierdzone przez TradingView. Więcej informacji znajduje się w Warunkach użytkowania.
Wyłączenie odpowiedzialności
Informacje i publikacje nie stanowią i nie powinny być traktowane jako porady finansowe, inwestycyjne, tradingowe ani jakiekolwiek inne rekomendacje dostarczane lub zatwierdzone przez TradingView. Więcej informacji znajduje się w Warunkach użytkowania.