
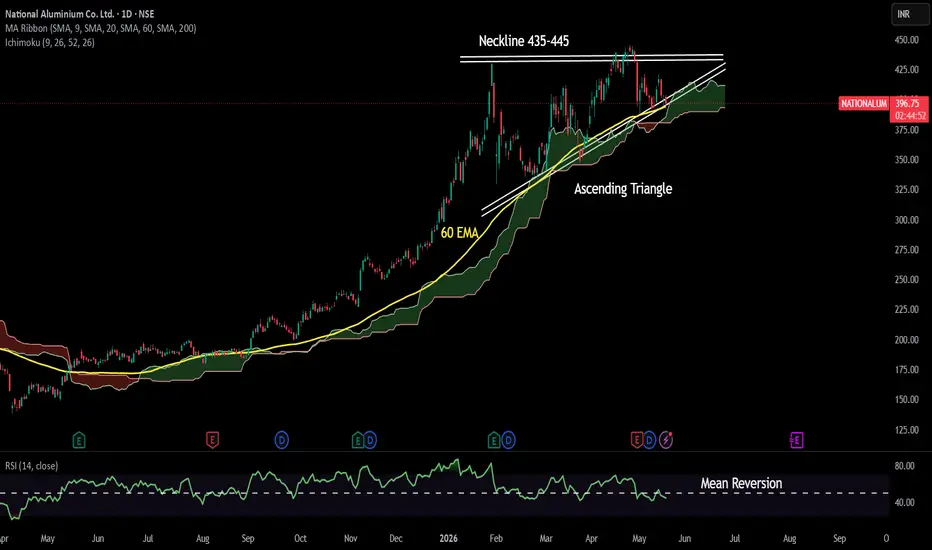
Date 19.05.2026
National Aluminium
Timeframe : Day Chart
"A long Term Investment" - AI Data Centrers + Deficit + Production Cap (China) + EV
The global market has flipped from an anticipated surplus into an acute structural deficit:
(1) The Deficit: Projected aluminium market deficit between 1.7 million and 2.4 million tonnes for 2026. Impact on Prices, highly Inflationary.
(2) China's Capacity Cap: China produces over half the world's aluminium but is hitting its strict 45 million metric tonne annual capacity cap. This limits its ability to bail out global supply shortages, leading Chinese firms to heavily import primary metal while scaling back net exports. Sustains global tightness.
(3) The Energy Crunch: Smelters globally are competing with AI data centres for power contracts. This prevents idled capacity in Europe and the US from turning back on economically. Supports higher-for-longer pricing.
(4) Resilient Demand: Global processed aluminium consumption is still forecast to grow to 106.8–107.3 million metric tons in 2026. Demand is anchored firmly by macro green-energy trends, electric vehicle (EV) manufacturing, electrical grid expansions, and massive rail/metro electrification projects in rapidly growing economies.
(5) Smelter Closures & Damage: Iranian missile strikes in March 2026 damaged Emirates Global Aluminium's (EGA) Al Taweelah facility. Other massive entities, like Aluminium Bahrain (Alba) and Qatar Aluminium, have curtailed output due to regional power and gas shortages.
(6) Record Physical Premiums: Because of logistical bottlenecks and physical scarcity, buyers are paying massive premiums to secure immediate metal. Japanese buyers, for instance, agreed to pay spot premiums of over $350 per ton, the highest in 11 years.
Valuations :
(1) Stock Pe = 12.6
(2) Roce = 39.6%
(3) Roe = 29.4%
(4) Peg Ratio = 0.21
(5) Ev/Ebita = 7.55
(6) Profit Growth (ttm) = 10%
(7) Cfo/Op = 105%
Regards,
Ankur Singh
National Aluminium
Timeframe : Day Chart
"A long Term Investment" - AI Data Centrers + Deficit + Production Cap (China) + EV
The global market has flipped from an anticipated surplus into an acute structural deficit:
(1) The Deficit: Projected aluminium market deficit between 1.7 million and 2.4 million tonnes for 2026. Impact on Prices, highly Inflationary.
(2) China's Capacity Cap: China produces over half the world's aluminium but is hitting its strict 45 million metric tonne annual capacity cap. This limits its ability to bail out global supply shortages, leading Chinese firms to heavily import primary metal while scaling back net exports. Sustains global tightness.
(3) The Energy Crunch: Smelters globally are competing with AI data centres for power contracts. This prevents idled capacity in Europe and the US from turning back on economically. Supports higher-for-longer pricing.
(4) Resilient Demand: Global processed aluminium consumption is still forecast to grow to 106.8–107.3 million metric tons in 2026. Demand is anchored firmly by macro green-energy trends, electric vehicle (EV) manufacturing, electrical grid expansions, and massive rail/metro electrification projects in rapidly growing economies.
(5) Smelter Closures & Damage: Iranian missile strikes in March 2026 damaged Emirates Global Aluminium's (EGA) Al Taweelah facility. Other massive entities, like Aluminium Bahrain (Alba) and Qatar Aluminium, have curtailed output due to regional power and gas shortages.
(6) Record Physical Premiums: Because of logistical bottlenecks and physical scarcity, buyers are paying massive premiums to secure immediate metal. Japanese buyers, for instance, agreed to pay spot premiums of over $350 per ton, the highest in 11 years.
Valuations :
(1) Stock Pe = 12.6
(2) Roce = 39.6%
(3) Roe = 29.4%
(4) Peg Ratio = 0.21
(5) Ev/Ebita = 7.55
(6) Profit Growth (ttm) = 10%
(7) Cfo/Op = 105%
Regards,
Ankur Singh

Wyłączenie odpowiedzialności
Informacje i publikacje nie stanowią i nie powinny być traktowane jako porady finansowe, inwestycyjne, tradingowe ani jakiekolwiek inne rekomendacje dostarczane lub zatwierdzone przez TradingView. Więcej informacji znajduje się w Warunkach użytkowania.
Wyłączenie odpowiedzialności
Informacje i publikacje nie stanowią i nie powinny być traktowane jako porady finansowe, inwestycyjne, tradingowe ani jakiekolwiek inne rekomendacje dostarczane lub zatwierdzone przez TradingView. Więcej informacji znajduje się w Warunkach użytkowania.